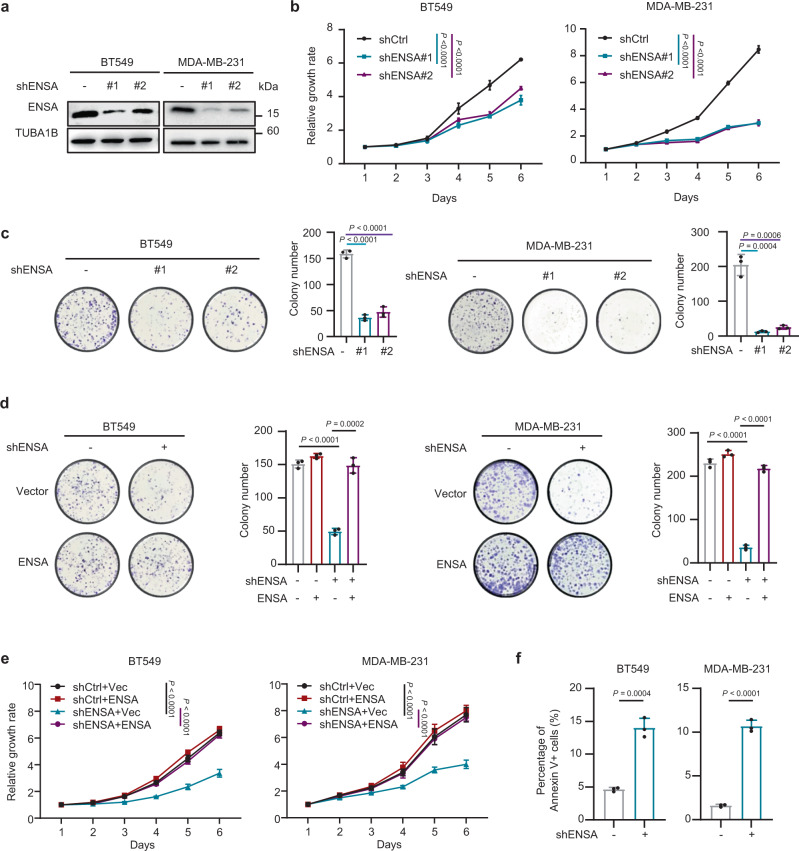
Fig. 2. ENSA is a major driver of TNBC cell growth.
a Stable silencing of ENSA expression in the TNBC cell lines BT549 and MDA-MB-231. b In vitro growth curves of BT549 and MDA-MB-231 cells expressing control or ENSA shRNA. n = 6. Data are presented as mean ± SD. Two-tailed two-way ANOVA tests. c Colony formation of BT549 and MDA-MB-231 cells expressing control or ENSA shRNA. n = 3. Data are presented as mean ± SD. Two-tailed unpaired Student’s t tests. d Colony formation of BT549 and MDA-MB-231 cells ± ENSA knockdown and ± ENSA overexpression. n = 3. Data are presented as mean ± SD. Two-tailed unpaired Student’s t tests. e In vitro growth curves of BT549 and MDA-MB-231 cells ± ENSA knockdown and ± ENSA overexpression. n = 6. Data are presented as mean ± SD. Two-tailed two-way ANOVA tests. f Apoptosis levels were measured in BT549 and MDA-MB-231 cells expressing control or ENSA shRNA. Percentage of annexin V+ cells are shown. n = 3. Data are presented as mean ± SD. Two-tailed unpaired Student’s t tests. Source data are provided as a Source Data file.

