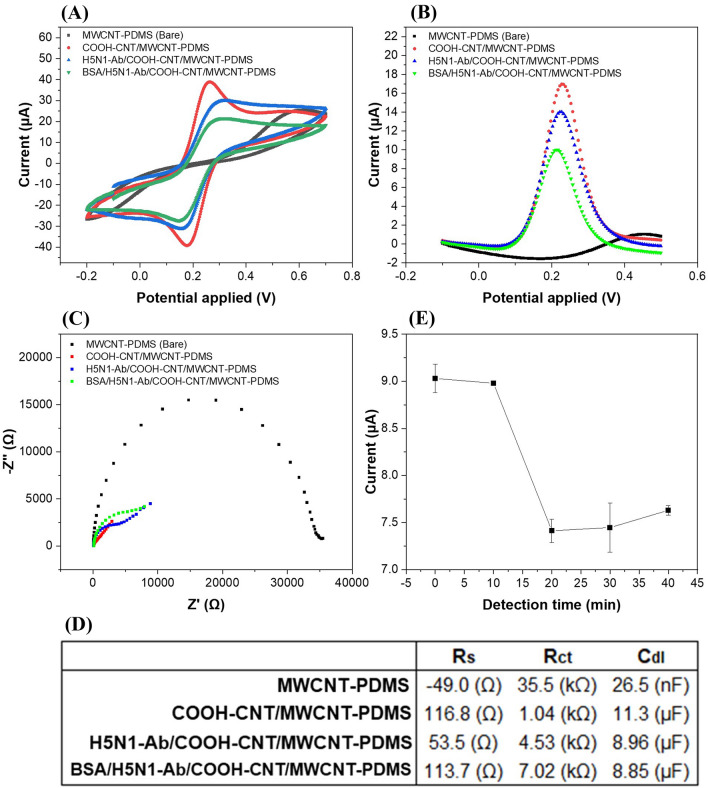
Figure 3.
(A) Cyclic voltammograms (scan rate: 50 mV/s), (B) differential pulse voltammograms, and (C) electrochemical impedance spectra of the MWCNT-PDMS, COOH-CNT/MWCNT-PDMS, H5N1-Ab/COOH-CNT/MWCNT-PDMS, and BSA/H5N1-Ab/COOH-CNT/MWCNT-PDMS electrodes. The inset shows the equivalent circuit for EIS measurement. (D) Measured values of the solution resistance (Rs), charge transfer resistance (Rct) and double layer capacitance (Cdl) in the MWCNT-PDMS, COOH-CNT/MWCNT-PDMS, H5N1-Ab/COOH-CNT/MWCNT-PDMS, and BSA/H5N1-Ab/COOH-CNT/MWCNT-PDMS electrodes. (E) The DPV peak currents measured for different incubation times for 10 µl of H5N1 HA detection (0, 10, 20, 30, and 40 min, concentration: 100 pg/ml, temperature = 25 °C). The error bars represent the standard deviations of three independent measurements.

