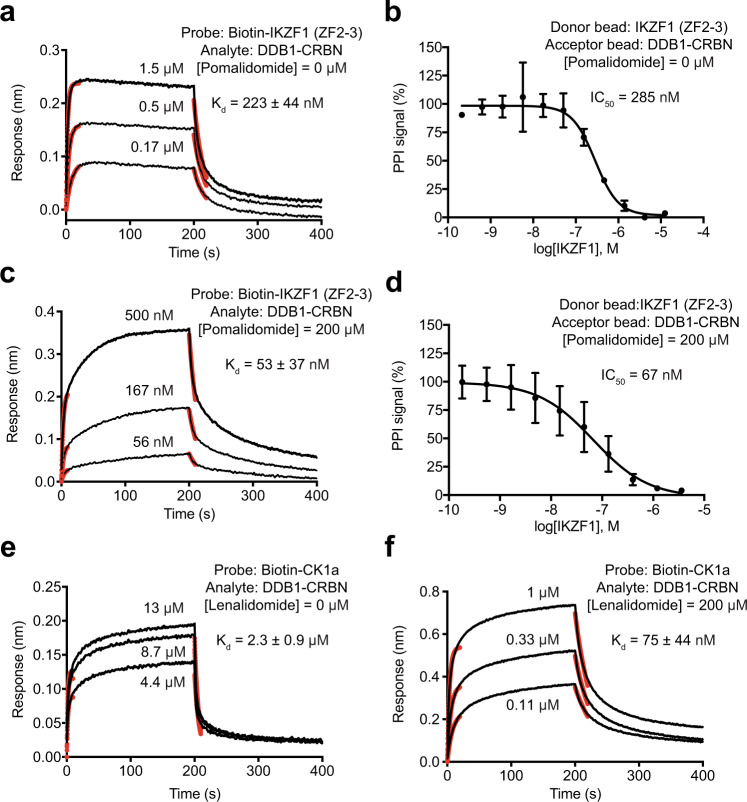
Fig. 6. Quantitative analysis of IMiDs system.
a, b BLI and AlphaScreen competition assays for assessing the intrinsic affinity of IKZF1 (ZF2-3) to DDB1–CRBN. Red lines represent curve fitting at the initial phase of association and dissociation. Kd, dissociation constant. IC50, half-maximum inhibitory concentration. Data were presented as mean ± s.d. of n = 3 biologically independent samples. Source data are provided as a Source Data file. c, d BLI and AlphaScreen competition assays for assessing the affinity of IKZF1 (ZF2-3) to DDB1–CRBN in the presence of pomalidomide at a saturating concentration. Red lines represent curve fitting at the initial phase of association and dissociation. Kd, dissociation constant. IC50, half-maximum inhibitory concentration. Data were presented as mean ± s.d. of n = 3 biologically independent samples. Source data are provided as a Source Data file. e, f BLI measurements of CK1a and DDB1–CRBN interaction in the absence and presence of lenalidomide at a saturating concentration. Red lines represent curve fitting at the initial phase of association and dissociation. Kd, dissociation constant. Source data are provided as a Source Data file.

