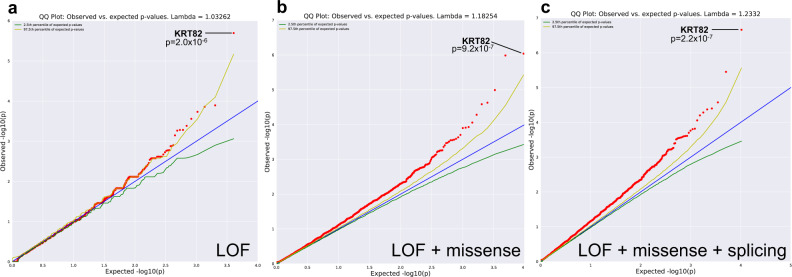
Fig. 1. Gene-level collapsing models identify significant rare variation in KRT82.
Q–Q plots of a Loss of Function (LOF) Model. b LOF + damaging missense Model. c LOF + missense + splicing variants predicted by high TraP scores (≥0.2). The genomic inflation factor (λ) is 1.03, 1.18, 1.23, respectively. The blue line represents the null hypothesis (observed p-values correspond to expected p-values), the yellow line marks the 2.5th percentile of expected p-values, and the green line marks the 97.5th percentile of expected p-values. p-value was determined by two-tailed Fisher’s exact test (FET).

