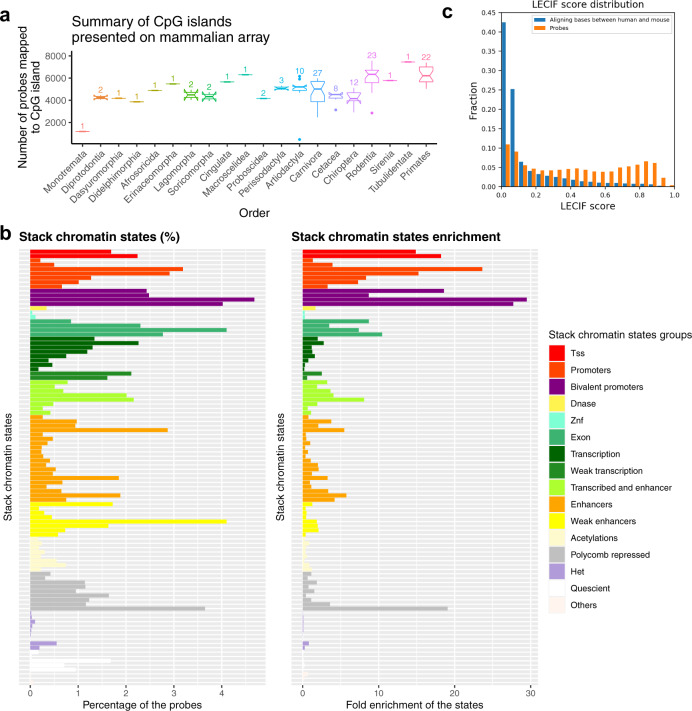
Fig. 3. CpG island and chromatin state analysis of mammalian methylation probes.
We characterize the CpGs located on the mammalian methylation array regarding a CpG island status in different phylogenetic orders, b chromatin state analysis, and c Learning Evidence of Conservation from Integrated Functional genomic annotations (LECIF) score of evidence of human-mouse conservation at the functional genomics level26. a Each boxplot depicts the median number of CpGs that map to CpG islands in mammalian species of a given phylogenetic order (x axis). The lower and upper bound of each box visualizes the lower and upper quartile of the distribution. The notch around the median number of CpGs (horizontal line inside box) depicts the 95% confidence interval. The whiskers extend to the most extreme data point, that is, no more than 1.5 times the interquartile range from the box. The numbers above each box report the number of analyzed species in each order, e.g., n = 22 primate species. b Mammalian methylation array enrichment for universal chromatin state annotations. (Left) Distribution of probe overlap with a universal chromatin state annotation by the stacked modeling approach of ChromHMM applied to data from more than 100 cell or tissue types19. Bars are colored based on their state corresponding state group as indicated by the legend on right. (Right) The same as left, but showing the fold enrichments of the state relative to a uniform background. The strongest enrichment is seen for some bivalent promoter states. A version of the figure with individual states labeled can be found in Supplementary Fig. 6. TSS, transcriptional start site; DNase, DNase I hypersensitivity; znf, zinc finger genes; Het, heterochromatin. c Comparison of distribution of LECIF score for probes on the array (orange) and aligning bases between human and mouse (blue). The LECIF score has been binned as shown on the x axis, and the fraction of probes or aligning bases with scores in that bin are shown on the y axis.

