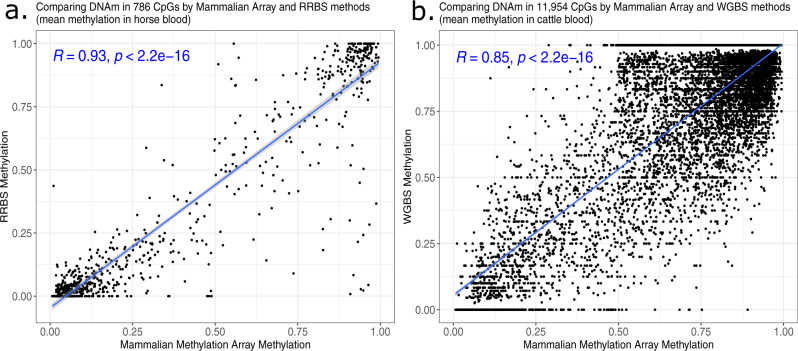
Fig. 6. Comparison with RRBS data from horse blood and WGBS from cattle blood.
Each dot corresponds to a cytosine. Mean methylation level in blood according to the mammalian array (x axis) versus corresponding mean values according to a reduced representation bisulfite sequencing and b whole-genome bisulfite sequencing in blood from horse and cattle, respectively. The mammalian methylation array data come from horse blood32 and cattle blood33. a The y axis reports the mean methylation levels in RRBS data from n = 18 whole blood samples from horses34. The RRBS sequence reads were downloaded from the SRA database under bioproject No. PRJNA517684 (processing described in methods). The analysis was restricted to 786 CpGs that could be mapped to both platforms. b mean methylation levels in WGBS data (y axis) from n = 2 blood samples from Holstein cattle35,36. The WGBS data are available from Gene Expression Omnibus (GSE147087). Only CpGs with sufficient read count (at least 3) were considered. The analysis was restricted to the 11,954 CpGs that could be mapped in both platforms. The blue text reports Pearson correlation coefficients and two-sided p-values calculated using a Student’s t-test. The two-sided p-values are at the numerical limitation of the correlation test function in R, thus capped at p < 2.2e−16. The blue line and shaded area correspond to a regression line and the 95% confidence interval, respectively, as determined by the default values of the R function geom_smooth.

