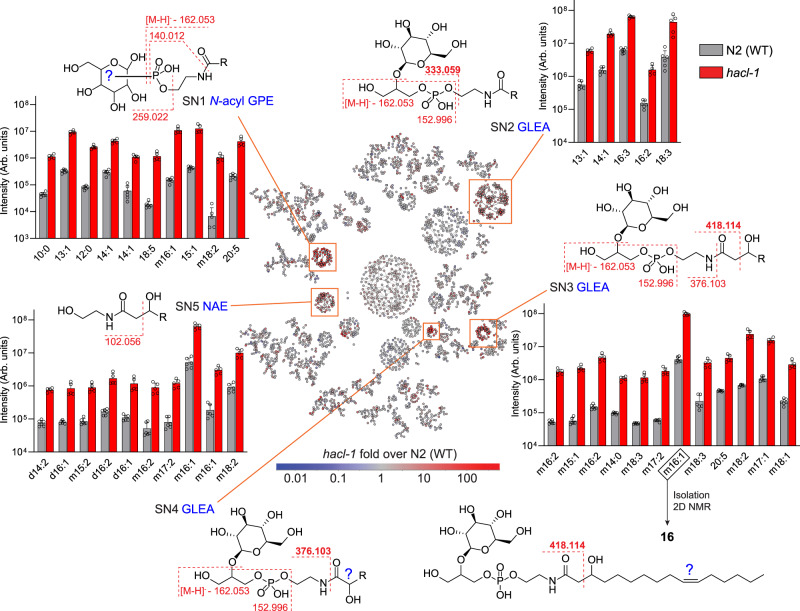
Fig. 4. MS/MS network comparing exo-metabolomes of hacl-1 and WT adults.
Proposed structures and major fragmentation reactions are shown for five subnetworks (SN1 – SN5, orange boxes). Example compounds in the bar graphs are at least 10-fold enriched in hacl-1 mutants relative to WT and satisfy mean intensity criteria (106 for SN1, SN2, SN3; 5 × 10⁵ for SN5). R represents an acyl group with N carbons and n degrees of unsaturation (N:n), preceded by m or d for mono- or di-oxygenated. The structure of the most abundant metabolite in SN3, GLEA-m16:1 (16), was characterized via 2D NMR spectroscopy. For compounds from SN4, see Supplementary Fig. 10. Data represent six (WT) or five (hacl-1) samples from three biologically independent experiments and bars means ± standard deviation. Source data are provided as a Source Data file.

