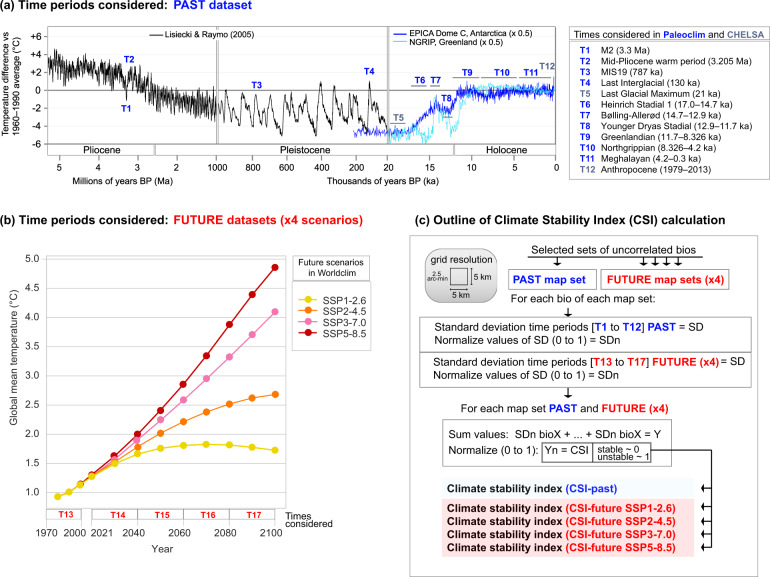
Fig. 1.
General overview of time periods considered to calculate the Climate Stability Index (CSI) for past and future map sets and graphical illustration of index generation. (a) Time periods used to estimate the CSI-past and from which paleoclimate data have been taken (from PaleoClim16 database, which includes two map sets from CHELSA25), represented by a Pliocene to Holocene temperature reconstruction modified from https://en.wikipedia.org/wiki/Geologic_temperature_record. Temperature reconstruction showed in a black line derived from Lisiecki and Raymo26. (b) Time periods and four Shared Socioeconomic Pathways (SSPs: SSP1-2.6, SSP2-4.5, SSP3-7.0, and SSP5-8.5) considered to estimate CSI-future using climate data from WorldClim17, modified from Gidden et al.27. (c) Schematic representation of the methodology employed to calculate the CSI for each map set.

