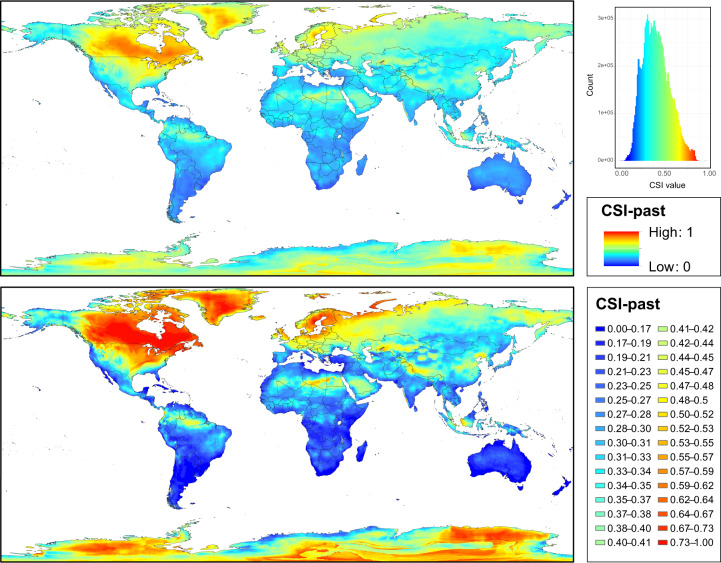
Fig. 2.
Maps of Climate Stability Index (CSI) values for the past map set from Pliocene (3.3 Ma) to present (1979–2013), at 2.5 arc-min grid resolution. Colours range from blue for low standard deviation (SD) values, which represents areas with low climatic fluctuations (i.e, low values of CSI) during the period Pliocene–present, to red for high SD values, which shows areas where high climatic fluctuations would have taken place (i.e., high values of CSI). On the upper map, the colour ramp shows equal interval breaks. The histogram with frequency and distribution of CSI values is also shown. On the lower map, the colour ramp has been manually adjusted to a defined set of break values (see details in the text).

