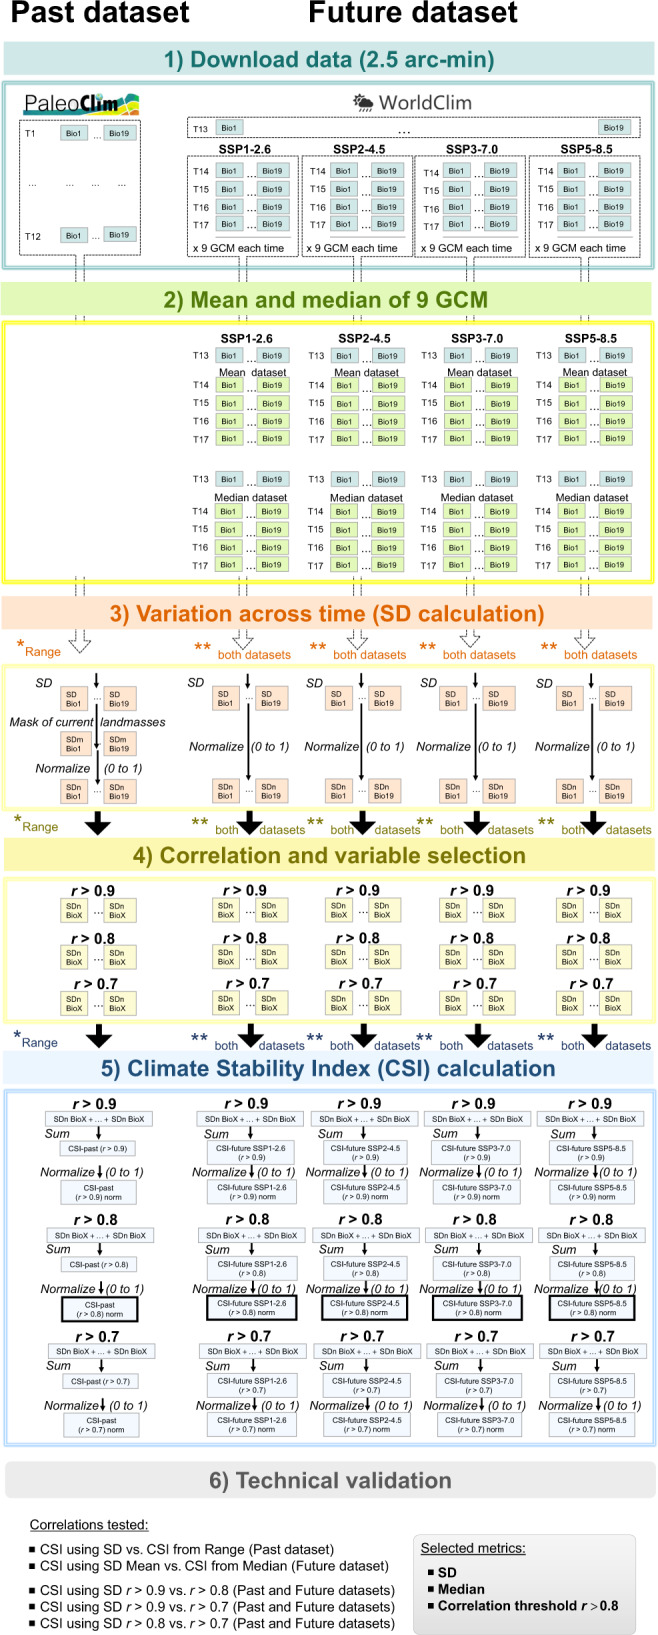
Fig. 5.

Detailed workflow of analyses employed to calculate and test the robustness of the Climate Stability Index (CSI) for past and future map sets. Final maps presented were obtained with conditions marked with wide-lined frame in the fifth step, which are: SD applying r > 0.8 threshold for variable correlation in past map set, and SD from median of nine GCM and applying r > 0.8 threshold for variable correlation in future map sets. Note that in the third step further analyses are repeated for the range statistic in the case of past map set and for both future map sets (mean and median).
