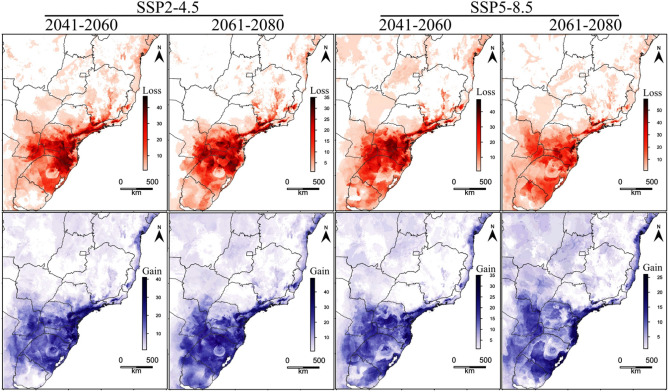
Figure 1.
Loss (red) and gain (blue) of BAH for 135 native potential agroforestry plant species in Brazil, obtained by stacking ENM binary predictions, based on different climate scenarios and years. Legend indicates the number of species. Maps created with custom R script. Version R 4.1.1 (https://www.R-project.org/). Base map source (Brazilian states shapefile) obtained from the Brazilian Institute of Geography and Statistics (https://www.ibge.gov.br/).

