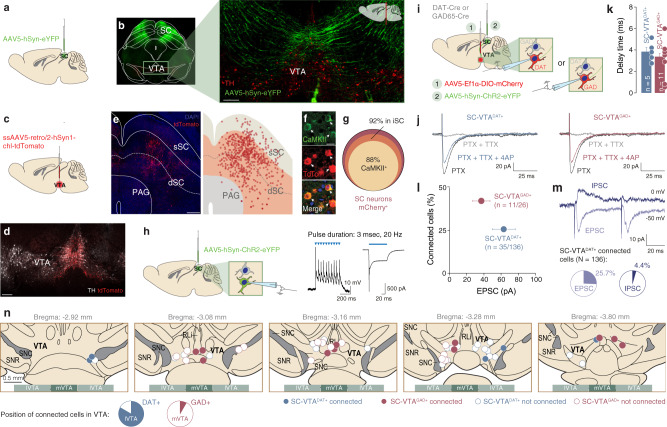
Fig. 1. Anatomo-functional connectivity from SC to VTA dopaminergic and GABAergic neurons.
a Schema of injection in the Superior Colliculus (SC) with AAV5-hSyn-eYFP. b Right: Representative coronal image of immunostaining experiments against Tyrosine Hydroxylase (TH) enzyme (in red) performed on midbrain slices of adult mice infected with AAV5-hSyn-eYFP (green) in the SC. The projecting fibers from SC to VTA are visible. Left: Image at higher magnification of the coronal slice (scale bar: 100 µm). The fibers project from SC to VTA (this experiment was reproduced at least three times). c Schema of injection in the VTA with ssAAV5-retro/2-hSyn1-chl-tdTomato. d Representative coronal image of ssAAV5-retro/2-hSyn1-chl-tdTomato injection site in the VTA. Immunostaining labelled TH-positive neurons (scale bar: 200 µm. This experiment was reproduced at least three times). e Left: Representative image of the infected cells with ssAAV5-retro/2-hSyn1-chl-tdTomato in the SC (scale bar: 200 µm. This experiment was reproduced at least three times). Right: schema reporting the position of tdTomato positive cells in the superficial (sSC) and intermediate/deeper layers (dSC) of the SC and in the periaqueductal grey (PAG) for six infected brains. f Representative image of immunostaining against Ca2+/calmodulin-dependent protein kinase II (CAMKII) in the SC and infected cells with ssAAV5-retro/2-hSyn1-chl-tdTomato (scale bar: 10 µm. This experiment was reproduced at least three times). g Quantification of tdTomato infected cells in the SC for six infected brains. The cells are preferentially located in the intermediate layer of the SC and are predominantly CAMKII+. h Whole-cell patch-clamp from SC ChR2-expressing neurons. Protocol of stimulation indicates that SC neurons follow 20 Hz light stimulation protocol. i Schema of injection in the SC with AAV5-hSyn-ChR2-eYFP and patch of the VTA DAT+ and GAD+ neurons (depending on the mice line). j Example traces of optogenetically elicited excitatory postsynaptic currents (EPSCs) in VTA DAT+ and GAD+ neurons in presence of PTX, TTX, and 4AP. k Delay time of the EPSCs for VTA DAT+ and GAD+ neurons. l Quantification of connected cells from SC onto VTA DAT+ and GAD+ neurons in relation of the amplitude of EPSCs. m Upper panel: Example traces of optogenetically elicited EPSCs or inhibitory postsynaptic currents (IPSCs) in VTA DAT+ neurons. Lower panel: Percentage of evoked EPSCs or IPSCs in the VTA DAT+ neurons connected with the SC. n Position of some patched VTA DAT+ and GAD+ neurons. SC-VTADAT+ connected neurons are mainly in the lateral part of the VTA (lVTA) while SC-VTAGAD+ connected neurons are more medially located (mVTA). n indicates number of cells. All the data are shown as the mean ± s.e.m. as error bars. Source data are provided as a Source Data file.

