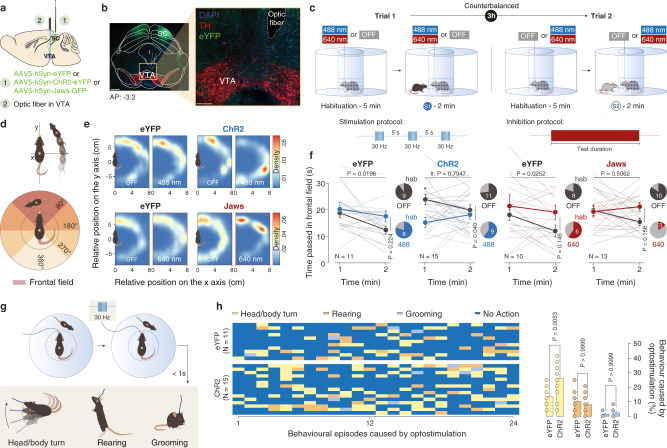
Fig. 3. Optogenetic manipulation of SC-VTA pathway alters orienting response.
a Schema of injections sites in SC with AAV5-hSyn-eYFP, AAV5-hSyn-ChR2-eYFP, or AAV5-hSyn-Jaws-GFP, and optic fiber implantation above the VTA. b Representative image of coronal midbrain slices of adult mice infected with AAV5-hSyn-eYFP (green) in the SC. In red is visible the immunostaining anti-Tyrosine Hydroxylase (TH) (Left panel: scale bar = 500 µm. Right panel: image at higher magnification, scale bar = 100 µm). Similar viral expression and OF location were observed in all the mice that performed the experiment described in Figs. 3c, 5b. c Top panel: Schema of the social orientation test. The eYFP-, ChR2- and Jaws-expressing mice oriented towards two different unfamiliar mice under both stimulation conditions. Bottom left panel: Stimulation and inhibition protocols. 8 pulses of 488 nm light (30 Hz) were separated by 5 s in the light ON condition. Bottom right panel: Continuous inhibition was instead provoked with 640 nm light. d Upper panel: schema representing the relative position of the social stimulus when the center body point of the experimental animals is fixed at (0, 0) and the nose point is fixed along the y-axis. Lower panel: schema representing the position of the frontal field. e Heatmaps reporting the relative position of the social stimulus during orientation test for the 1st and 2nd minute in the different conditions. f Time passed with the social stimulus in the frontal field for the 1st and 2nd minute of the social orienting test in light and no-light conditions. RM two-way ANOVA (eYFP488 nm: Light main effect: F(1,10) = 1.683, P = 0.2236; Time main effect: F(1,10) = 7.711, P = 0.0196; Light × Time Interaction: F(1,10) = 1.254, P = 0.2890. ChR2: Light main effect: F(1,14) = 5.138, P = 0.0398; Time main effect: F(1,14) = 0.070, P = 0.7947; Light × Time Interaction: F(1,14) = 4.868, P = 0.0446. eYFP640 nm: Light main effect: F(1,9) = 2.537, P = 0.1456; Time main effect: F(1,9) = 7.185, P = 0.0252; Light × Time Interaction: F(1,9) = 0.6144, P = 0.4533. Jaws: Light main effect: F(1,12) = 2.266, P = 0.1581; Time main effect: F(1,12) = 0.4696, P = 0.5062; Light × Time Interaction: F(1,12) = 4.572, P = 0.0538) followed by Bonferroni’s multiple comparisons post-hoc test. Pie charts represent the percentage of mice that decrease the orientation between 1st and 2nd minute. g Possible behaviors caused by the optostimulation and observed less than 1 sec after a burst of light. h Left panel: identification and report of the behavioral episodes caused by optostimulation. Right panel: quantification of the behavioral episodes caused by optostimulation. Two-way ANOVA (Behavior main effect: F(1.874,43.09) = 60.95, P < 0.0001; Group main effect: F(1, 23) = 3.684, P = 0.0674; Behavior × Group Interaction: F(2, 46) = 11.29, P = 0.0001) followed by Bonferroni’s multiple comparisons post-hoc test. N indicates the number of mice. # indicates significantly different interaction. All the data are shown as the mean ± s.e.m. as error bars. Source data are provided as a Source Data file.

