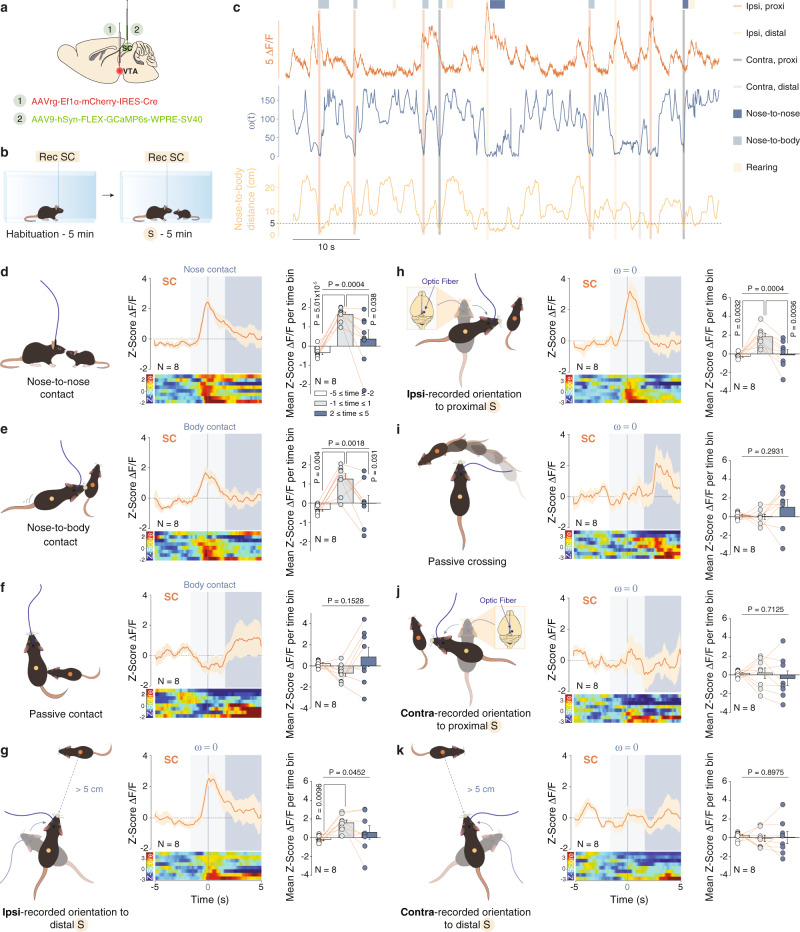
Fig. 4. Calcium activity of SC and mPFC to VTA-projecting neurons during free social interaction.
a Schema of injections of AAVrg-Ef1α-mCherry-IRES-Cre in the VTA and AAV9-hSyn-FLEX-GCaMP6s-WPRE-SV40 in the SC. b Schema of free social interaction test. c Example traces. ΔF/F signals recorded in SC-VTA-projecting neurons aligned with instantaneous head orientation ω(t) and the distance between the nose of the experimental mouse and the gravity center of the stimulus mouse during the free social interaction test. Ipsi-recorded (proximal and distal) and contra-recorded (proximal and distal) head/body turn episodes are reported as well as the manual scoring of the nose-to-nose, nose-to-body and passive contacts. d Left: Schema of nose-to-nose contact. Middle: Peri-event time histogram (PETH) of normalized ΔF/F for SC-VTA-projecting neurons, centered on nose-to-nose contacts. Right: Mean ΔF/F (Z-score) before, during and after nose-to-nose. RM one-way ANOVA (Events main effect: F(2,7) = 14.15, P = 0.0004) followed by Bonferroni-Holm post-hoc test correction. e Left: Schema of nose-to-body contact. Middle: PETH of normalized ΔF/F for SC-VTA-projecting neurons, centered on nose-to-body contacts. Right: Mean ΔF/F (Z-score) before, during and after nose-to-body. RM one-way ANOVA (Events main effect: F(2,7) = 10.3, P = 0.0018) followed by Bonferroni-Holm post-hoc test correction. f Left: Schema of passive contact. Middle: PETH of normalized ΔF/F for SC-VTA-projecting neurons, centered on passive contacts. Right: Mean ΔF/F (Z-score) before, during and after passive contacts. RM one-way ANOVA (Events main effect: F(2,7) = 2.15, P = 0.1528). g Left: Schema of ipsilateral recorded orientation to distal social stimulus. Middle: Peri-event time histogram (PETH) of normalized ΔF/F for SC-VTA-projecting neurons, centered on distal ipsilateral orientation. Right: Mean ΔF/F (Z-score) before, during and after distal ipsilateral orientation. RM one-way ANOVA (Events main effect: F(2,7) = 3.8947, P = 0.0452) followed by Bonferroni-Holm post-hoc test correction. h Left: Schema of ipsilateral recorded orientation to proximal social stimulus. Middle: Peri-event time histogram (PETH) of normalized ΔF/F for SC-VTA-projecting neurons, centered on proximal ipsilateral orientation. Right: Mean ΔF/F (Z-score) before, during and after proximal ipsilateral orientation. RM one-way ANOVA (Events main effect: F(2,7) = 14.45, P = 0.0004) followed by Bonferroni-Holm post-hoc test correction. i Left: Schema of passive crossing of social stimulus in the frontal field. Middle: Peri-event time histogram (PETH) of normalized ΔF/F for SC-VTA-projecting neurons, centered on passive crossing. Right: Mean ΔF/F (Z-score) before, during and after passive crossing. RM one-way ANOVA (Events main effect: F(2,7) = 1.3413, P = 0.2931) followed by Bonferroni-Holm post-hoc test correction. j Left: Schema of contralateral recorded orientation to proximal social stimulus. Middle: Peri-event time histogram (PETH) of normalized ΔF/F for SC-VTA-projecting neurons, centered on proximal contralateral orientation. Right: Mean ΔF/F (Z-score) before, during and after proximal contralateral orientation. RM one-way ANOVA (Events main effect: F(2,7) = 0.3474, P = 0.7125) followed by Bonferroni-Holm post-hoc test correction. k Left: Schema of contralateral recorded orientation to distal social stimulus. Middle: Peri-event time histogram (PETH) of normalized ΔF/F for SC-VTA-projecting neurons, centered on distal contralateral orientation. Right: Mean ΔF/F (Z-score) before, during and after distal contralateral orientation. RM one-way ANOVA (Events main effect: F(2,7) = 0.1090, P = 0.8975) followed by Bonferroni-Holm post-hoc test correction. N indicates the number of mice. All the data are shown as the mean ± s.e.m. as error bars or error bands. Source data are provided as a Source Data file.

