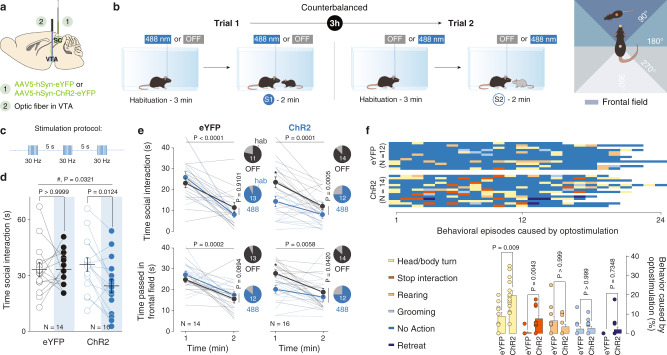
Fig. 5. Optogenetic manipulation of SC-VTA pathway alters social interaction and perturbs head orientation towards conspecific.
a Schema of injections sites in SC with AAV5-hSyn-eYFP or AAV5-hSyn-ChR2-eYFP, and optic fiber implantation above the VTA. b Left panel: Schema of free social interaction. The eYFP- and ChR2-expressing mice freely interacted with two different unfamiliar mice under both stimulation conditions. Right panel: schema representing the position of the frontal field. c Stimulation protocols: 8 pulses of 488 nm light (30 Hz) were separated by 5 s in the light ON condition. d Time social interaction during the free social interaction test for eYFP- and ChR2-expressing mice in the SC. RM two-way ANOVA (Light main effect: F(1,28) = 5.0855, P = 0.0321; Virus main effect: F(1,28) = 0.8528, P = 0.3637; Light × Virus Interaction: F(1,28) = 4.1962, P = 0.0500) followed by Bonferroni-Holm post-hoc test correction. e Upper panels: time passed interacting with the social stimulus for the 1st and 2nd minute of the free social interaction test in light and no-light conditions. RM two-way ANOVA (eYFP: Light main effect: F(1,13) = 0.013, P = 0.9101; Time main effect: F(1,13) = 34.64, P < 0.0001; Light × Time Interaction: F(1,13) = 3.487, P = 0.085. ChR2: Light main effect: F(1,15) = 19.43, P = 0.0005; Time main effect: F(1,15) = 26.38, P = 0.0001; Light × Time Interaction: F(1,15) = 1.878, P = 0.1907) followed by Bonferroni’s multiple comparisons post-hoc test. Lower panels: time passed with the social stimulus in the frontal field for the 1st and 2nd minute of the free social interaction test in light and no-light conditions. RM two-way ANOVA (eYFP: Light main effect: F(1,13) = 3.368, P = 0.0894; Time main effect: F(1,13) = 25.31, P = 0.0002; Light × Time Interaction: F(1,13) = 0.01355, P = 0.9091. ChR2: Light main effect: F(1,15) = 5.006, P = 0.042; Time main effect: F(1,15) = 10.59, P = 0.0058; Light × Time Interaction: F(1,15) = 2.749, P = 0.1196) followed by Bonferroni’s multiple comparisons post-hoc test. Pie charts represent the percentage of mouse that decreases the interaction/orientation between 1st and 2nd minute. f Upper panel: identification and report of the behavioral episodes caused by a burst of optostimulation. Lower panel: quantification of the behavioral episodes caused by a burst of optostimulation. Two-way ANOVA (Behavior main effect: F(2.791, 66.99) = 23.43, P < 0.0001; Group main effect: F(1, 24) = 12.73, P = 0.0016; Behavior × Group Interaction: F(4, 46) = 6.539, P = 0.0001) followed by Bonferroni’s multiple comparisons post-hoc test. N indicates the number of mice. # indicates significantly different interaction. All the data are shown as the mean ± s.e.m. as error bars. Source data are provided as a Source Data file.

