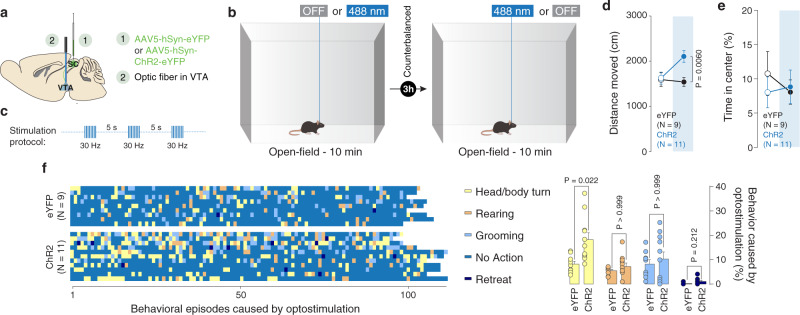
Fig. 6. SC-VTA optostimulation increases exploratory behavior.
a Schema of injections sites in SC with AAV5-hSyn-eYFP or AAV5-hSyn-ChR2-eYFP, and optic fiber implantation above the VTA. b Schema of the open-field arena. The mice are free to explore the apparatus for 10 min in both stimulations’ conditions. c Stimulation protocols: 8 pulses of 488 nm light (30 Hz) were separated by 5 s in the light ON condition. d Distance moved in the open-field arena for eYFP and ChR2 mice under light and no-light stimulation. RM two-way ANOVA (Light main effect: F(1,18) = 4.0046, P = 0.0607; Virus main effect: F(1,18) = 4.8210, P = 0.0415; Light × Virus interaction: F(1,18) = 4.8217, P = 0.0415) followed by Bonferroni-Holm post-hoc test correction. e Time passed in the center of the open-field arena for eYFP and ChR2 mice under light and no-light stimulation. RM two-way ANOVA (Light main effect: F(1,18) = 0.1628, P = 0.6913; Virus main effect: F(1,18) = 0.145, P = 0.7078; Light × Virus interaction: F(1,18) = 0.546, P = 0.4695). f Right panel: identification and report of the behavioral episodes caused by a burst of optostimulation. Left panel: quantification of the behavioral episodes caused by a burst of optostimulation. Two-way ANOVA (Behavior main effect: F(2.004, 36.08) = 20.47, P < 0.0001; Group main effect: F(1, 18) = 5.370, P = 0.0325; Behavior × Group Interaction: F(3, 54) = 3.364, P = 0.0251) followed by Bonferroni’s multiple comparisons post-hoc test. N indicates the number of mice. # indicates significantly different interaction. All the data are shown as the mean ± s.e.m. as error bars. Source data are provided as a Source Data file.

