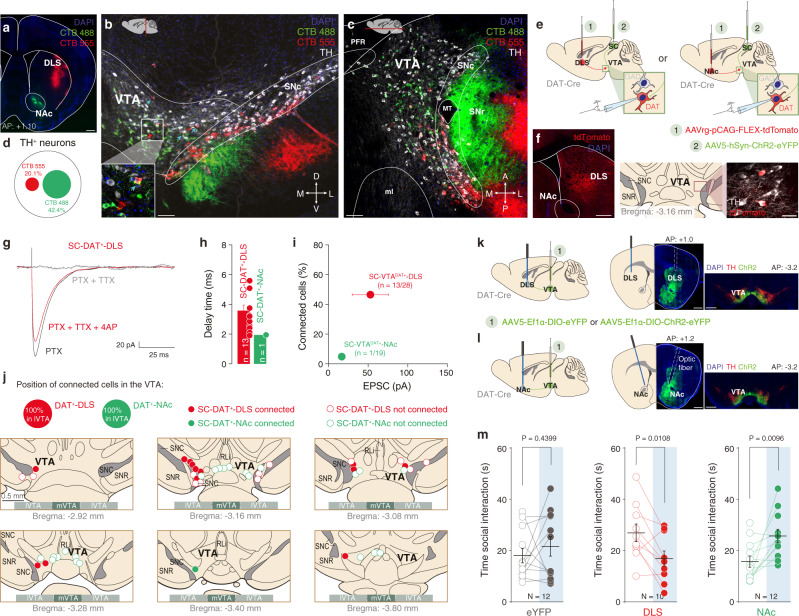
Fig. 7. SC is mainly connected to VTA DAT+ neurons which project to DLS.
a Representative image of the NAc and DLS in coronal slice infected with the CTB-488 and CTB-555 (scale bar 500 µm. This experiment was reproduced at least three times). b Coronal plane image of the VTA with TH staining (white) and infected cells projecting to the NAc or DLS (scale bar = 100 µm. This experiment was reproduced at least three times). c Horizontal plane image of the VTA with TH staining (white) and infected cells projecting to the NAc or DLS (scale bar = 100 µm. This experiment was reproduced at least three times). d Proportion of TH+ and either TH+/CTB-488+ (NAc-projecting VTA DAT+ neurons) or TH+/CTB-555+ (DLS-projecting VTA DAT+ neurons). e Schema of injections in DAT-Cre mice. The SC was infected with AAV5-hSyn-ChR2-eYFP and the NAc or the DLS with the AAVrg-pCAG-FLEX-tdTomato. Whole-cell patch was then performed in DAT+ neurons projecting to two different regions. f Left panel: Representative image of the AAVrg-pCAG-FLEX-tdTomato site of injection in the DLS (scale bar = 500 µm). Right panel: example of DAT+ neurons projecting to DLS (scale bar = 20 µm). This experiment was reproduced at least three times. g Example traces of optogenetically elicited excitatory postsynaptic currents (EPSCs) in VTA DAT+ neurons projecting to DLS in presence of PTX, TTX, and 4AP. h Delay time of the EPSCs for VTA DAT+-NAc or DAT+-DLS neurons. i Quantification of connected cells from SC onto VTA DAT+-NAc or DAT+-DLS neurons in relation of the amplitude of EPSCs. The VTA DAT neurons receiving projections from the SC are mainly projecting to the DLS with the highest current amplitude. j Position of some patched VTA DAT+-NAc or DAT+-DLS neurons. SC-VTADAT+-DLS connected neurons are mainly in the lateral part of the VTA (lVTA). k Left panel: Schema of injections sites in the VTA of DAT-Cre mice with AAV5-Ef1α-DIO-eYFP or AAV5-Ef1α-DIO-ChR2-eYFP, and optic fiber implantation above the DLS. Middle panel: representative image showing the fiber optic’s track in the DLS (scale bar = 500 µm). Right panel: representative image of the site of injection in the VTA (scale bar = 500 µm). Similar viral expression and OF location were observed in all the mice that performed the experiment which results are shown in Fig. 7l. l Left panel: Schema of injections sites in the VTA of DAT-Cre mice with AAV5-Ef1α-DIO-ChR2-eYFP or AAV5-Ef1α-DIO-eYFP, and optic fiber implantation above the NAc. Middle panel: representative image showing the fiber optic’s track in the NAc (scale bar = 500 µm). Right panel: representative image of the site of injection in the VTA (scale bar = 500 µm). Similar viral expression and OF location were observed in all the mice that performed the experiment which results are shown in Fig. 7l. m Left panel: VTA DAT+-NAceYFP and VTA DAT+-DLSeYFP mice do not change time of social interaction between the two stimulation conditions. Paired t-test two-sided (t(11) = −0.8013). Middle panel: VTA DAT+-DLSChR2 mice decrease the time of social interaction during light ON condition. Paired t-test two-sided (t(11) = 3.2015). Right panel: VTA DAT+-NAcChR2 mice increase the time of social interaction during light ON condition. Paired t-test two-sided (t(11) = −2.8177). N, n indicate number of mice and cells respectively. All the data are shown as the mean ± s.e.m. as error bars. Source data are provided as a Source Data file.

