Fig. 2.
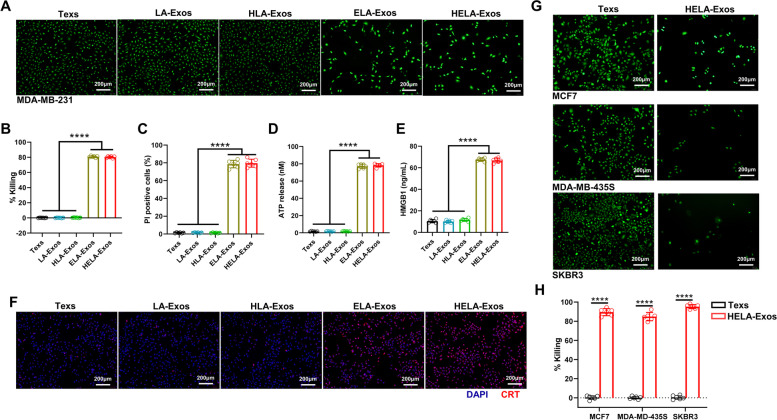
In vitro killing capacity of HELA-Exos. A to F MDA-MB-231 cells were treated with Texs, LA-Exos, HLA-Exos, ELA-Exos, or HELA-Exos for 48 h. A and B Representative images of calcein-AM fluorescence and the quantitative detection of MDA-MB-231 cell viability. Scale bar, 200 μm. The data are presented as the mean ± SD; n = 6. One-way ANOVA was performed for statistical analysis (****: P < 0.0001). C Apoptosis analysis by PI staining and flow cytometry. The data are presented as the mean ± SD; n = 6. One-way ANOVA was performed for statistical analysis (****: P < 0.0001). D and E ATP release and HMGB1 release were evaluated by ELISA. The data are presented as the mean ± SD; n = 6. One-way ANOVA was performed for statistical analysis (****: P < 0.0001). F The surface exposure of CRT on MDA-MB-231 cells was evaluated by CLSM. Blue: DAPI; Red: CRT. Scale bar, 200 μm. G and H MCF7, MDA-MB-435S, and SKBR3 cells were treated with Texs or HELA-Exos for 48 h. Representative images of calcein-AM fluorescence and the quantitative detection of cell viability in different cells. Scale bar, 200 μm. The data are presented as the mean ± SD; n = 6. A t test was performed for statistical analysis (****: P < 0.0001). ICD: immunogenic cell death; CRT: calreticulin; CLSM: confocal laser scanning microscopy

