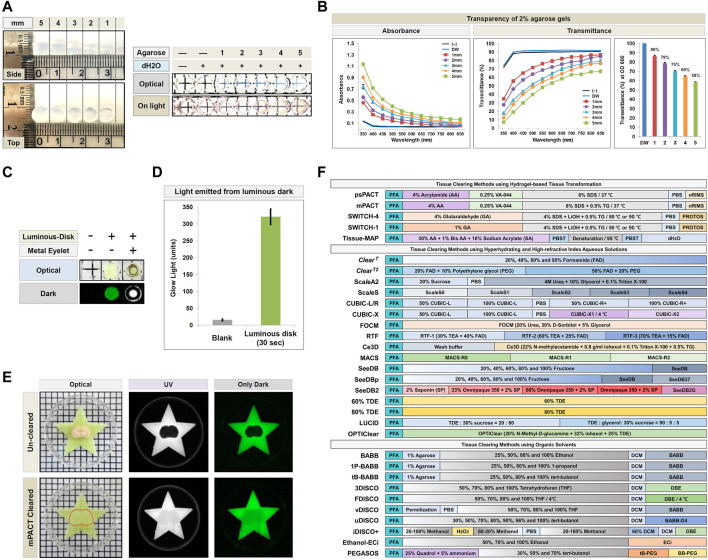
FIGURE 2.
Demonstration of the PACA platform and schematic of the tissue clearing methods used in the present study. (A,B) Absorbance and transmittance (%) of 2% agarose gels of varying thickness (1–5 mm) at 350–850 nm. Each color line and bar point to assessment values of dH2O (DW; blue) and 2% agarose gel discs of differing thickness. Red (square), 1 mm; Violet (round), 2 mm; sky blue (triangle), 3 mm; Yellow (diamond), 4 mm; Green (square), 5 mm. All experiments quantifying gel transparency were performed in triplicate, and data are presented as the mean ± SD (standard deviation) of three separate experiments. (C) Comparison of light emitted by the luminous disk. (D) Quantification of light transmitted from the luminous disk (SrAl2O4:Eu2+, Dy3+ photoluminescent; Excitation wavelength of luminous disk: 200–450 nm, peak value: 520 nm) exposure for 30 s in the dark, and compared to a blank control. An average of three measurements (glow light mean value: unit) was calculated for the luminous disk using Gel Doc XR. (E) Comparison of light transmission between an uncleared 4 mm thick mouse brain and a sample cleared with mPACT on a luminous disk in both UV and dark conditions. The transparency and size of the sample was evident against a patterned background (length:width = 5 mm:5 mm). (F) Schematic representation of the 32 protocols of the 28 tissue clearing techniques used in this comparative study.

