FIGURE 3.
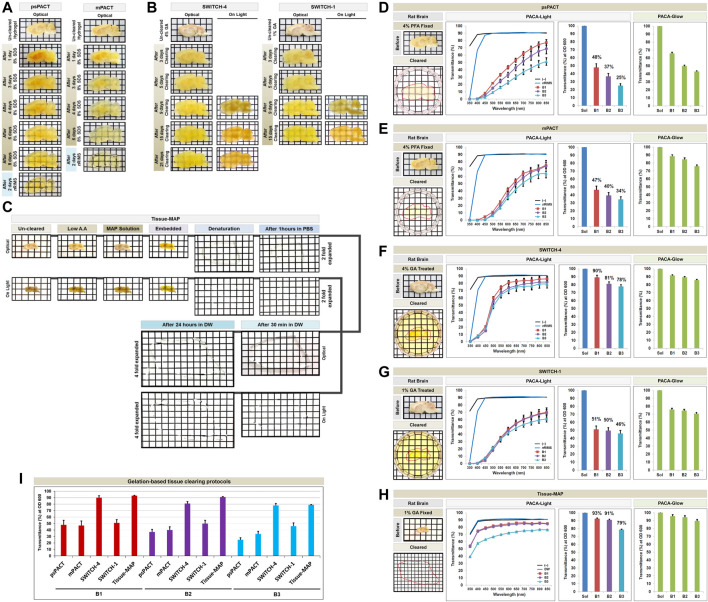
Comparison of tissue clearing achieved with hydrogel-based tissue clearing protocols. Comparison of the optical clearing processes of PACTs (psPACT and mPACT) (A), SWITCHs (SWITCH-1 and SWITCH-4) (B), and Tissue-MAP (C) in rat brain samples (3 mm thickness). Comparison of clearing efficacies of psPACT (D), mPACT (E), SWITCH-4 (F), SWITCH-1 (G), and Tissue-MAP (H) in rodent brain samples with both PACA-Light and PACA-Glow. Optical images showing samples after clearing (red dotted line), along with any changes in sample size upon tissue processing, are included (also Supplementary Figure S12). (I) Comparison of clearing efficacies of hydrogel-based tissue clearing protocols. Three discs from three distinct brain regions (B1: prefrontal cortex and basal ganglia, B2: cerebral cortex and midbrain/diencephalon, B3: cerebellum) were generated and analyzed for each sample. Each color line and bar point to assessment values of empty (black) and refractive index matching solution (blue) of each protocol, and three distinct regions of the brain the B1 (square, red), B2 (diamond, violet), and B3 (triangle, sky blue). Green bars point to assessment values of glow light (unit) in dark. Results reflect three replicates of each experiment, and data are presented as the mean ± SD (standard deviation). The transparency of the cleared brain was evident against a patterned background (length:width = 5 mm:5 mm).

