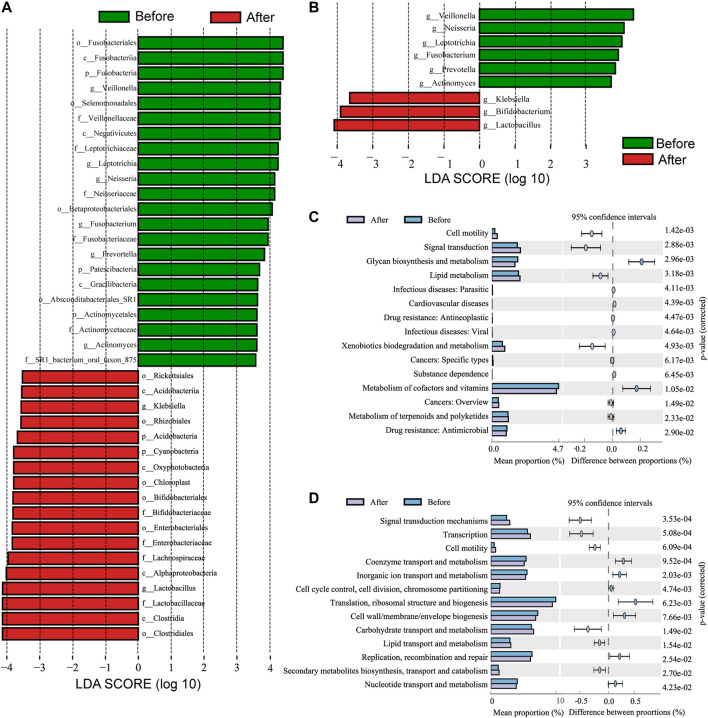
FIGURE 3.
Linear discriminant analysis effect size (LefSe) and linear discriminant analysis (LDA) analysis characterized microbiomes between the before- and after-LS capsule administration groups. (A) LDA scores showing the significant bacterial difference between the before- and after-administration groups. Only taxa with LDA scores of >3.5 are presented. Prefix p_ phyla, c_ class, o_ order, f_ family, and g_ genus. (B) LDA scores showed a significant bacterial difference between the before- and after-administration groups at the genus level. (C) Significant Kyoto Encyclopedia of Genes and Genomes (KEGG) pathway at level 2 and (D) Cluster of Orthologous Groups of proteins (COG) at level 2 for the pharynx microbiome in the before- and after-administration groups identified using STAMP software. In STAMP, the differences in abundance between the PH and control groups were analyzed using the White t test. Multiple test correction: Benjamini–Hochberg false discovery rate (p < 0.05).

