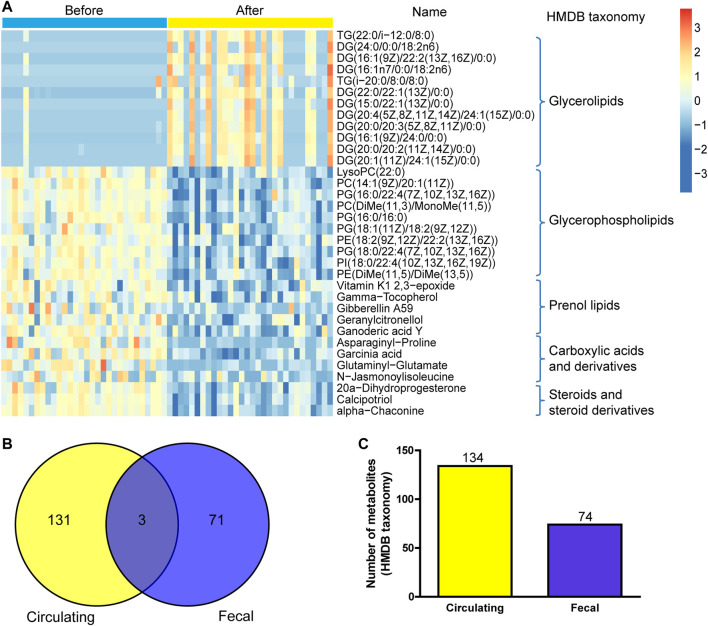
FIGURE 7.
Correlation analysis of fecal metabolites and circulating metabolites. (A) Hierarchical clustering analysis for the fecal metabolites in the before- and after-administration groups based on their z-normalized abundances. The name and HMDB taxonomy clusters of the metabolites were listed. (B) Venn and number (C) of HMDB taxonomy metabolite with differences in serum and fecal samples before and after administration.

