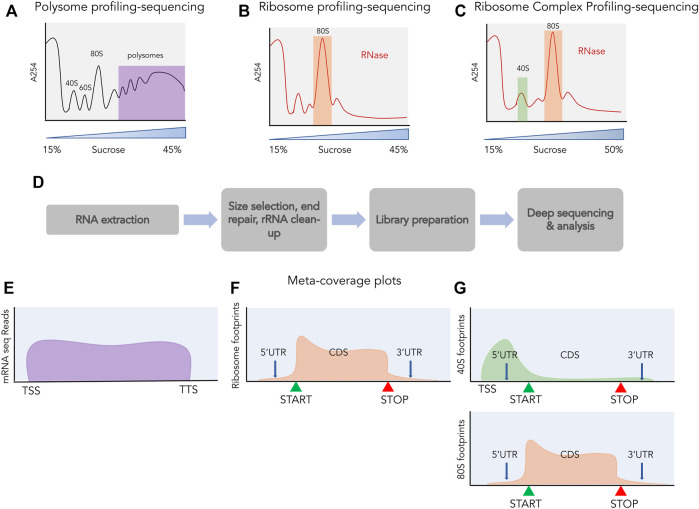
FIGURE 3.
Profiling and sequencing of translating transcripts. A254 profiles shown before (A) and after digestion with ribonucleases (B,C). The fractions used for further processing are highlighted, polysomes in purple, 80S in orange and 40S in green. (D) The process of library preparation for next generation sequencing. Size selection of ∼30 nt is done for ribosome profiling and ribosome complex profiling sequencing and libraries are prepared from the size selected small RNAs, whereas for polysome profiling, libraries are prepared from total RNA. Meta-coverage shown for reads obtained from polysome profiling sequencing (E), for ribosome profiling (F) and for ribosome complex profiling [(G) top: 40S, bottom: 80S].

