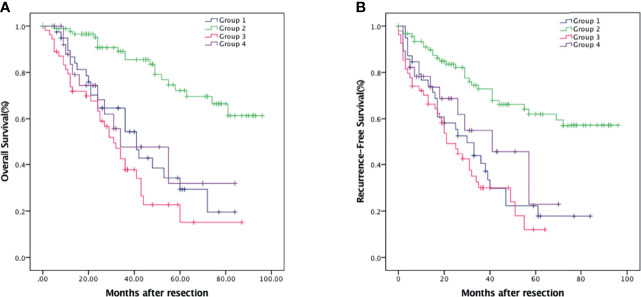
Figure 4.
Kaplan–Meier survival analysis of HCC patients showing survival curves stratified according to the combination of NLR and PNI. OS (A) and RFS (B) curve comparing different groups. Group 1, NLR <3.29 and PNI <43.75 (n = 42); Group 2, NLR <3.29 and PNI ≥43.75 (n = 91); Group 3, NLR ≥3.29 and PNI <43.75 (n = 54); Group 4, NLR ≥3.29 and PNI ≥43.75 (n = 28).

