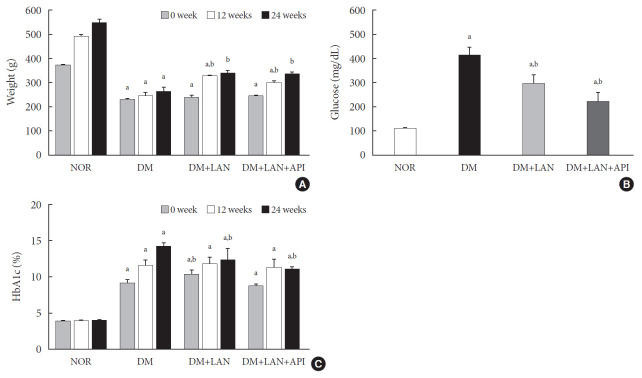
Fig. 1.
(A) Body weight change, (B) mean blood glucose levels on the first day of week 24, and (C) glycosylated hemoglobin (HbA1c) levels in the experimental groups. Values are presented as mean±standard error of mean. NOR, normal; DM, diabetes mellitus; DM+LAN, DM treated with insulin glargine; DM+LAN+API, DM treated with insulin glargine and glulisine (n=8–10 in each group). aP<0.05 vs. normal, bP<0.05 vs. DM.

