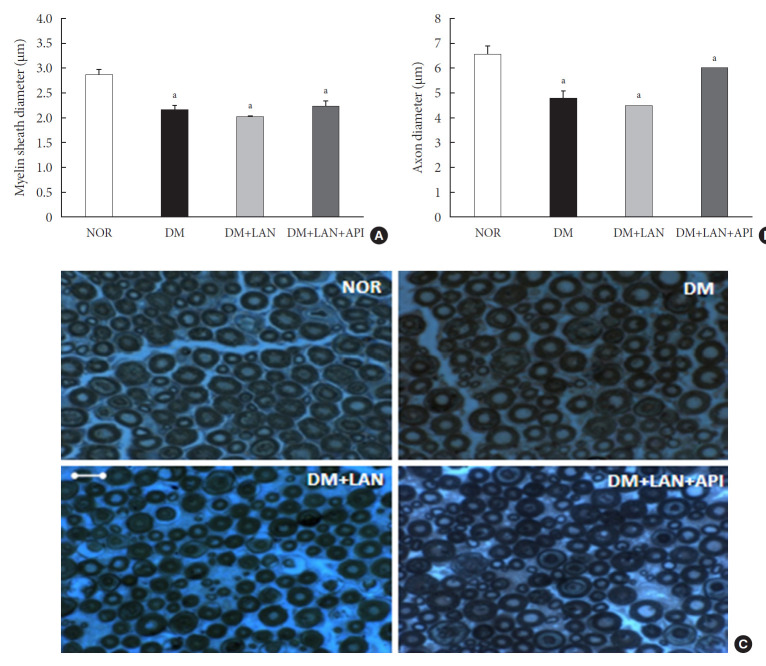
Fig. 6.
Quantitative comparison of sciatic nerve, including (A) the diameter of myelin sheath, (B) the diameter of axon, and (C) immunohistochemistry of the sciatic nerve of the experimental groups (×1,000). Bar indicates 20 μm. Values are presented as mean±standard error of mean. NOR, normal; DM, diabetes mellitus; DM+LAN, DM treated with insulin glargine; DM+LAN+API, DM treated with insulin glargine and glulisine (n=8–10 in each group). aP<0.05 vs. normal, bP<0.05 vs. DM.

