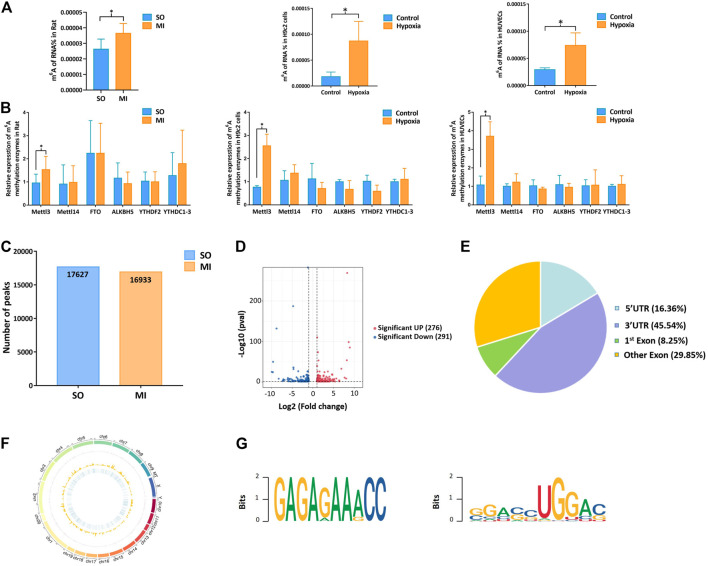
FIGURE 2.
Mettl3 induced upregulation of m6A methylation level in myocardial tissue, H9c2 cells, and HUVECs. (A) m6A methylation level of MI rat and hypoxic cells; (B) expression of m6A methylation enzymes in myocardial tissue samples and cells by qRT-PCR; (C) number of peaks in the SO and MI group; (D) volcano plots for differentially methylated m6A peaks; (E) distribution of differentially methylated m6A peaks in the SO and MI group; (F) distribution patterns of differentially m6A methylated peaks on chromosomes; (G) sequence motif for the m6A peak regions. UTR, untranslated region; Exon, expressed region; SO, sham operated; MI, myocardial infarction. *p < 0.05.

