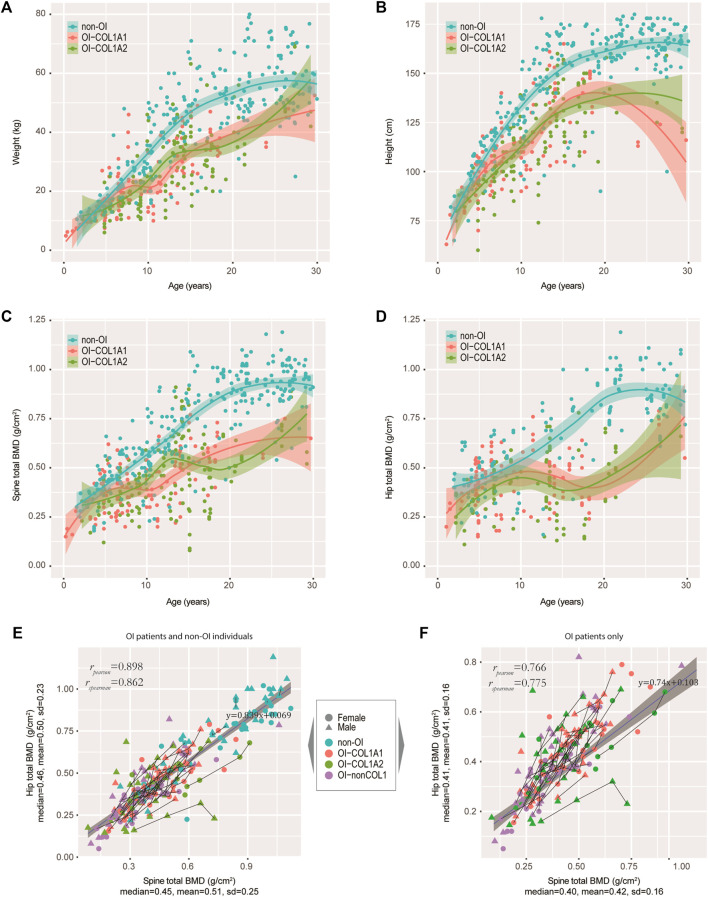
FIGURE 3.
Tracking the weight, height and BMD in our OI cohort. (A−D) Growth curves of weight (A), height (B), spine BMD (C), and hip BMD (D) were tracked. Non-OIs were randomly retrieved from our hospital information system with gender and aged matched (per age group), and served as controls for comparison. Each dot represents one measurement for one individual. (E) Scatter plot showing the correlation between spine and hip BMDs in our OI and non-OI cohorts combined. (F) Scatter plot showing the correlation between spine and hip BMDs in our OI cohort only. Line segments indicated measurements of the same individuals.

