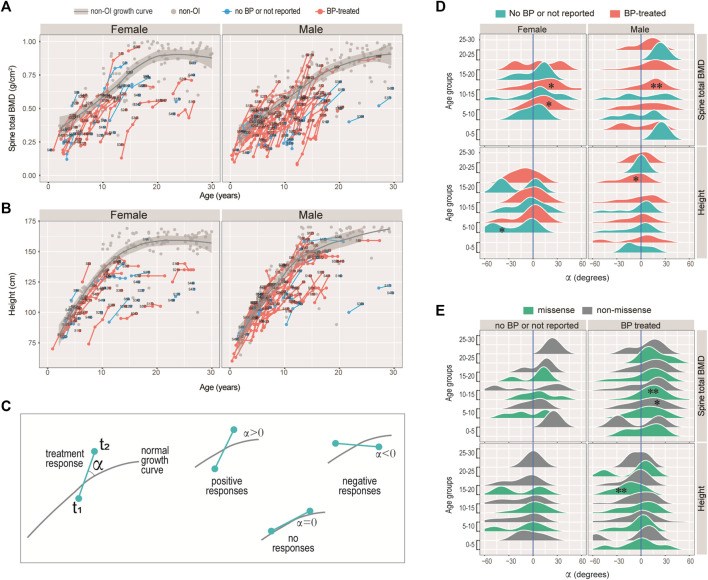
FIGURE 4.
Responses of bisphosphonate (BP) treatment. (A–B) Growth curves for spinal BMD (A), and height (B) for the female and male patients with COL1A1/2 variants in our cohort. Line segments indicated measurements of the same individuals. Text labels were anonymized patient IDs. (C) Diagram illustrating the strategy measuring BP responses. The angle α was measured between the slope of the consecutive measurements and the tangential slope in the controls. A positive angle indicates stronger growth rate as compared with the controls, and a negative one indicates otherwise. (D–E) Ridge plots showing the BP responses of spinal BMD and height with respect to sex, BP-history and age-groups (D), or to variant type, BP-history and age-groups (E). *: Wilcoxon test p < 0.05; **: p < 0.01; unmarked box: no significant difference.

