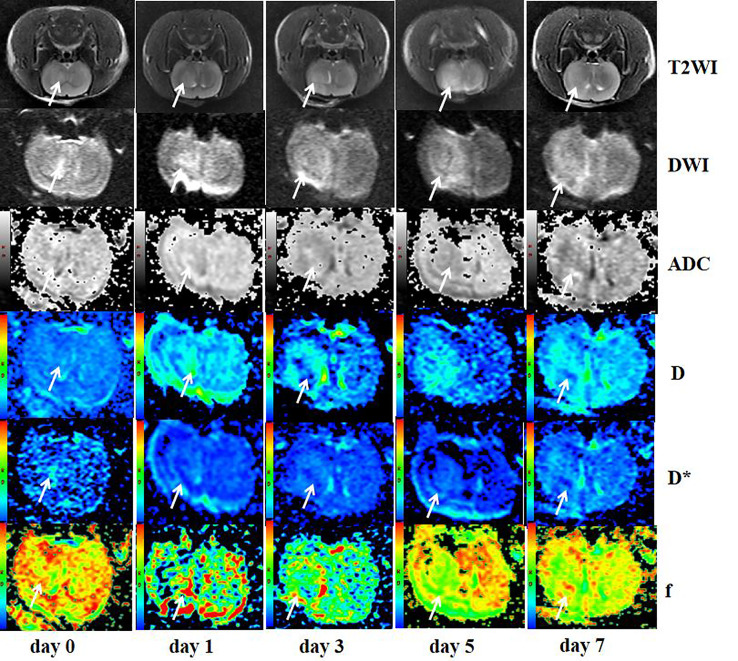
Figure 4.
Axial T2WI, DWI (b = 1000), ADC, and pseudocolor maps of D, D*, and f at different time points in the treated group. T2WI image showed the tumor grew slowly from day 0 to day 7 (arrows) and presented hyperintensity on DWI images and hypointensity on ADC maps (arrows). Color ranging from blue to red represented values ranging from low to high. D-values increased gradually (arrows), while D*- and f-values decreased during the 7 days (arrows).

