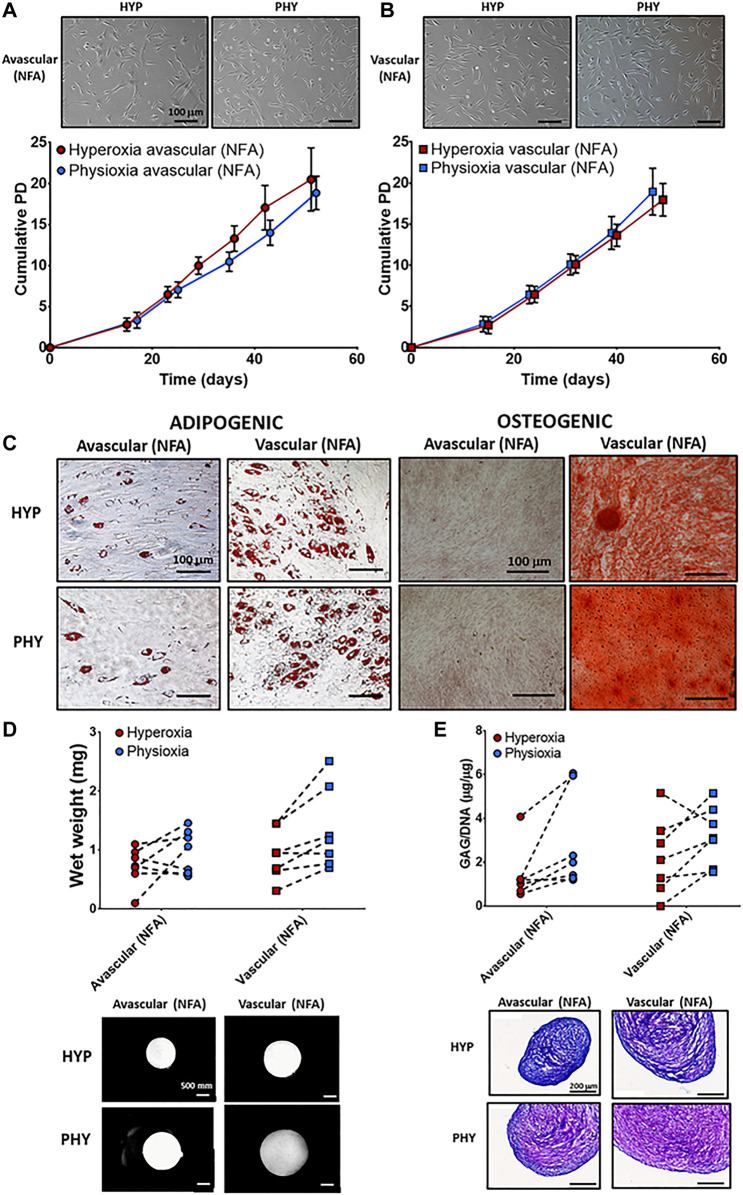
FIGURE 2.
Representative photomicrographs of hyperoxia (HYP) and physioxia (PHY) expanded NFA (A) avascular and (B) vascular meniscus cells with corresponding population growth curves (n = 7; mean ± S.D.). (C) Representative photomicrographs of Oil-red-O staining for lipid droplet and alizarin red staining for calcium deposition for meniscus populations under hyperoxia (HYP) and physioxia (PHY). Pellet (D) wet weight (E) GAG content for avascular and vascular meniscus cells with representative (D) macroscopic and (E) DMMB-stained pellets.

