FIGURE 3.
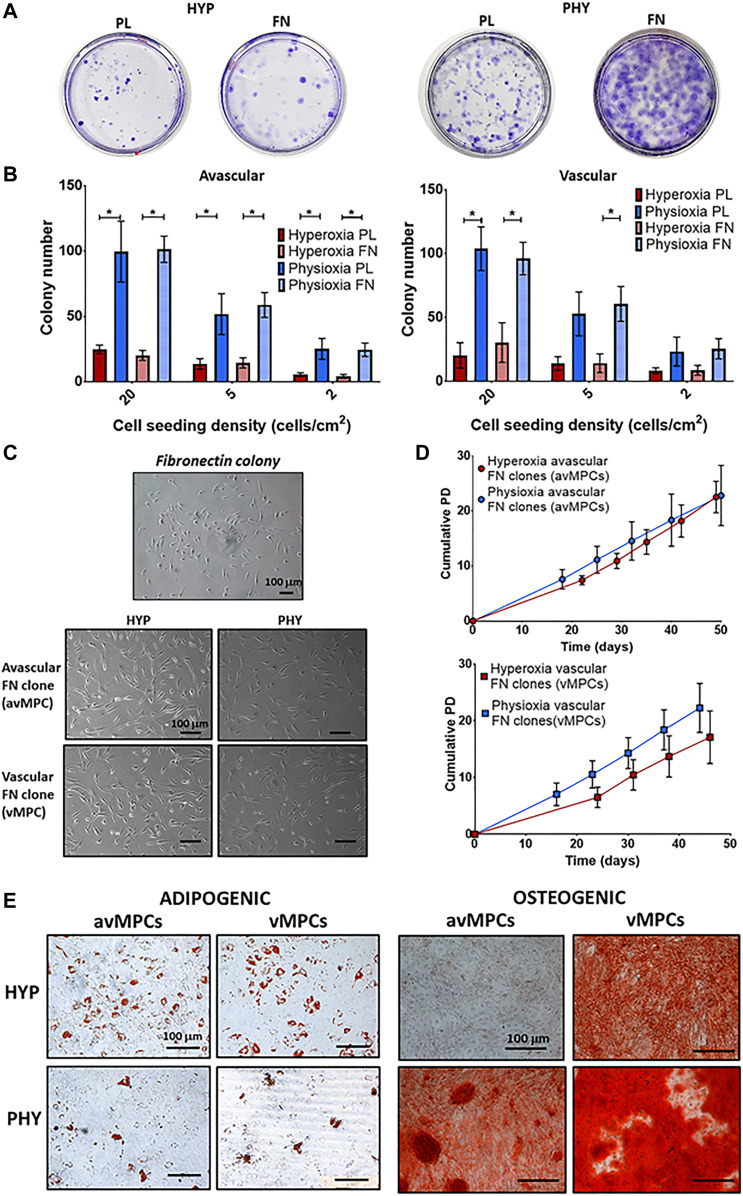
(A) Representative crystal violet-stained colonies cultured under hyperoxia (HYP) and physioxia (HYP) on uncoated (PL) and fibronectin (FN)-coated dishes. (B) Number of colonies counted from conditions described in (A) from avascular and vascular meniscus cells (n = 6; data represent mean ± S.D.; *p < 0.05). (C) Representative photomicrographs of a fibronectin colony and avMPCs and vMPCs cultured under hyperoxia and physioxia with (D) population growth curves for expanded avMPC and vMPC population under hyperoxia and physioxia [n = 4 (3 clones/donor); data represent mean ± S.D.]. (E) Representative Oil-red-O staining for lipid droplet formation and alizarin red staining for calcium deposition for avMPCs and vMPCs.

