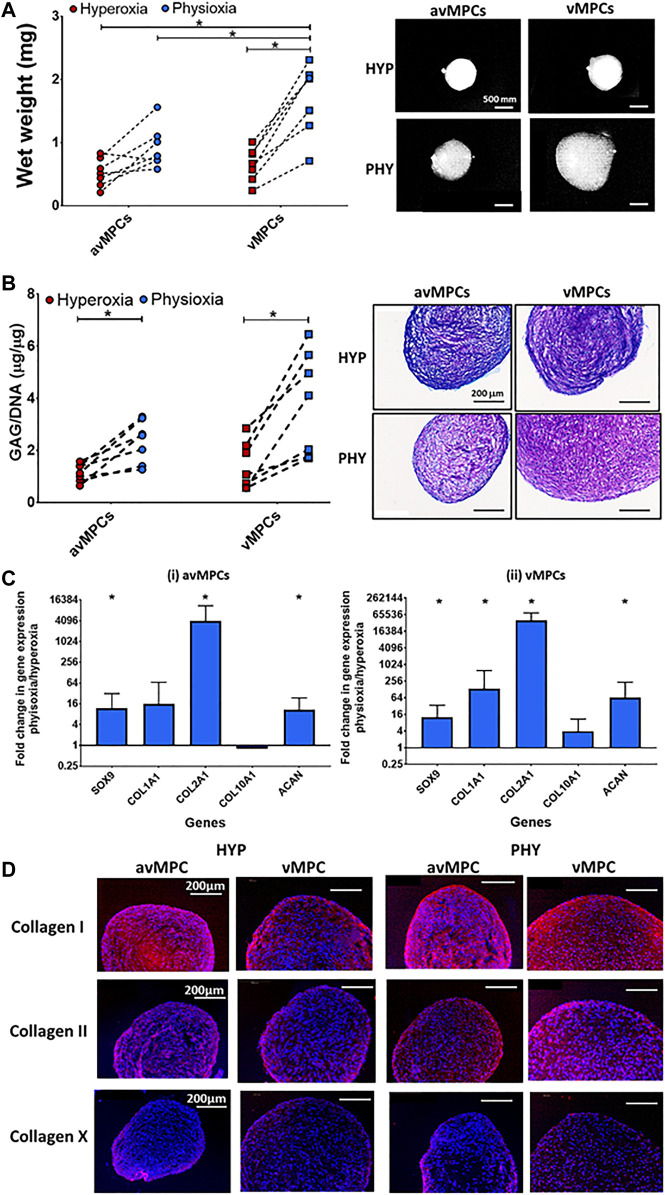
FIGURE 4.
Chondrogenic differentiation of avMPCs and vMPCs under hyperoxia and physioxia. Dot plot for pellet (A) wet weight and (B) GAG content for isolated clones (each dot represents mean of individual three clones) cultured under hyperoxia and physioxia with representative (A) macroscopic and (B) DMMB-stained pellets. (C) Gene expression data for meniscus matrix genes for (i) avascular and (ii) vascular MPCs. Data represent fold change for (i) avascular and (ii) vascular MPCs cultured under physioxia relative to corresponding clones under hyperoxic conditions (data represent mean ± S.D.; n = 5 donors; *p < 0.05). (D) Representative images of avMPC and vMPCs pellets stained with collagen I, collagen II, and collagen X cultured under hyperoxia and physioxia. Positive and negative controls are in Supplementary Figure S1.

