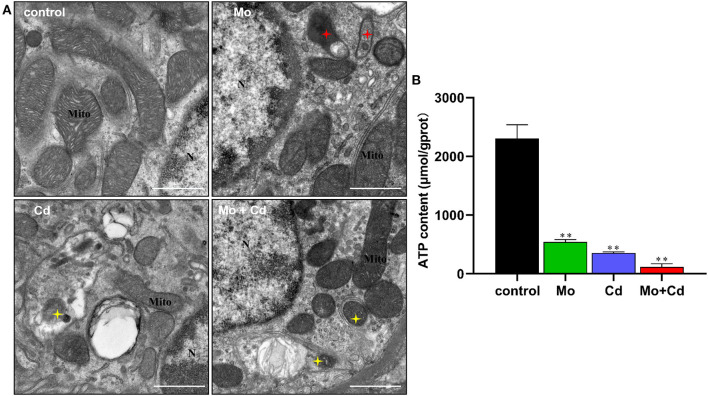
Figure 3.
Effect of Mo or/and Cd on ATP level and ultrastructure of the kidney. (A) The ultrastructural structure of the kidney. Red asterisks mark vacuole-mitochondria. Yellow asterisks indicate mitophagosomes. “N” means nucleus, “Mite” means mitochondrion, scale bar = 1 μm. (B) ATP content. Data are expressed as means ± SD (n = 6). “*” indicates significant difference compared to the corresponding control (*P < 0.05, **P < 0.01). “#” indicates statistically significant difference between corresponding groups (#P < 0.05, ##P < 0.01).

