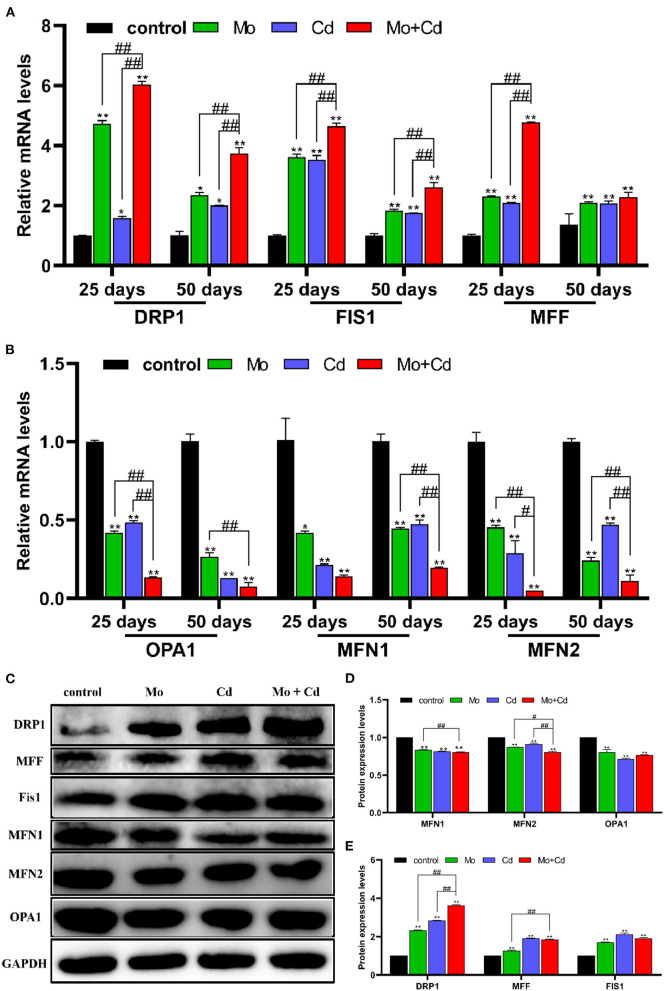
Figure 4.
Mo or/and Cd exposure regulated Mitochondrial fusion and fission (mitochondrial dynamics). (A) The mRNA levels of DRP1, MFF and FIS1, (B) The mRNA levels of MFN1, OPA1 and MFN2. (C) The western blot results of DRP1, MFF, FIS1, MFN1, OPA1 and MFN2. (D,E) The quantification of DRP1, MFF, FIS1, MFN1, MFN2, OPA1 and PGC-1α protein levels. Data are expressed as means ± SD (n = 6). “*” indicates significant difference compared to the corresponding control (*P < 0.05, **P < 0.01). “#” indicates statistically significant difference between corresponding groups (#P < 0.05, ##P < 0.01).

