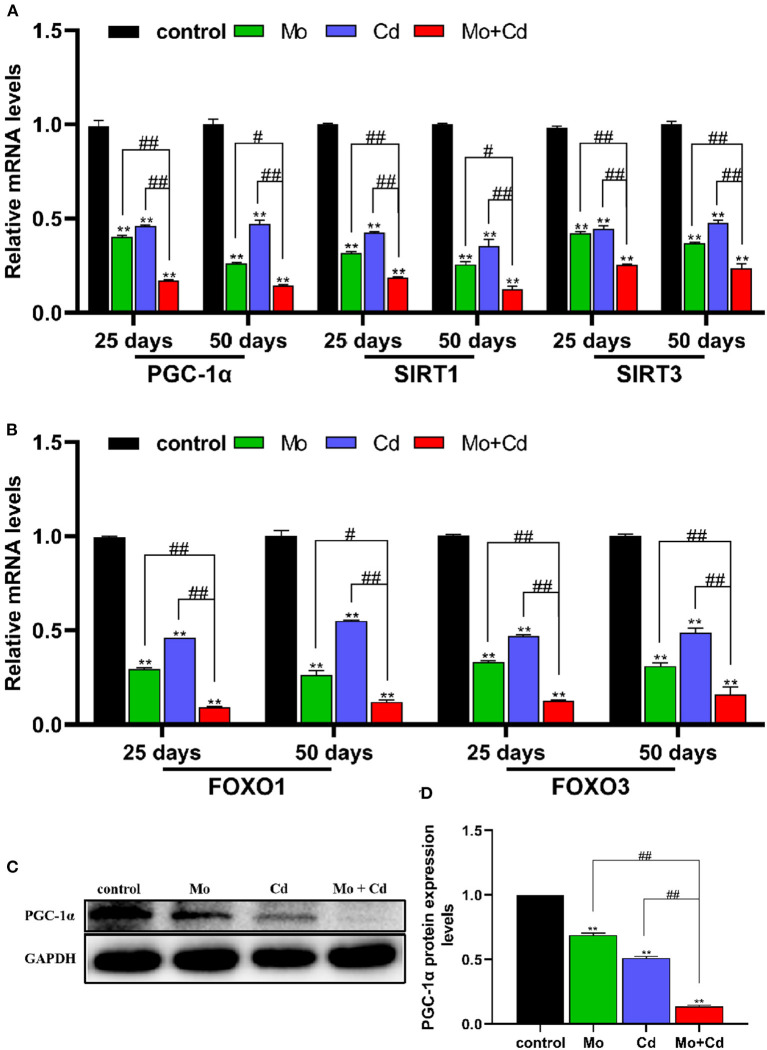
Figure 5.
Mo or/and Cd exposure regulated mitochondrial biogenesis. (A,B) The mRNA levels of PGC-1α, SIRT1, SIRT3, FOXO1 and FOXO3. (C) The western blot results of PGC-1α. (D) The quantification of PGC-1α protein levels. Data are expressed as means ± SD (n = 6). “*” indicates significant difference compared to the corresponding control (*P < 0.05, **P < 0.01). “#” indicates statistically significant difference between corresponding groups (#P < 0.05, ##P < 0.01).

