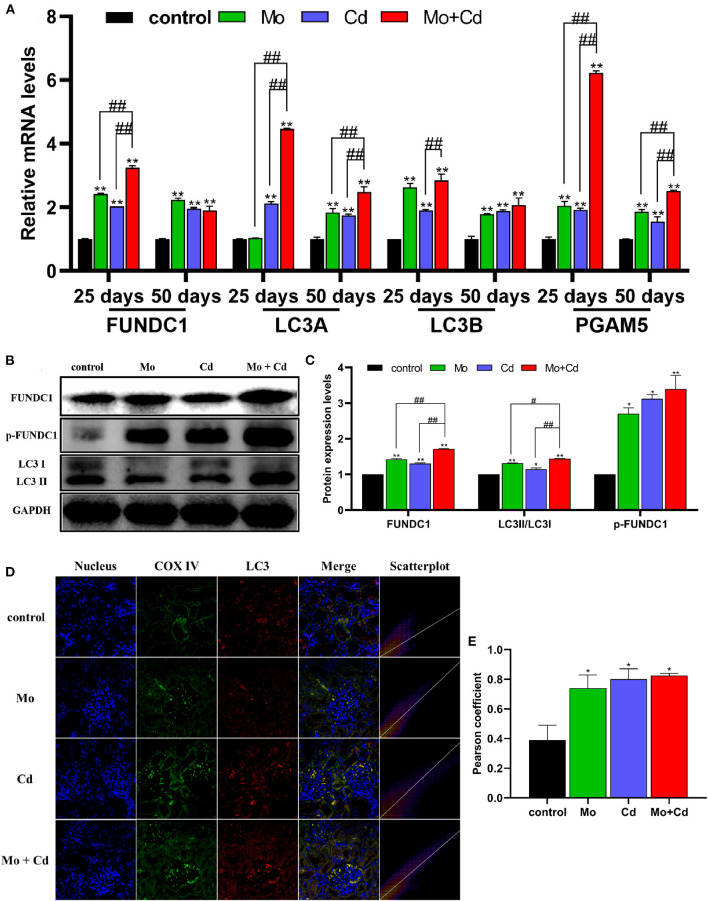
Figure 6.
Effects of Mo and/or Cd on immunofluorescence of LC3, mitophagy-related mRNA and protein expression levels. (A) The mRNA levels of FUNDC1, LC3A, LC3B and PGAM5. (B) The western blot results of FUNDC1, p-FUNDC1 and LC3. (C) The quantification of FUNDC1, p-FUNDC1 (Ser17) and LC3II/LC3I protein levels. (D) Immunofluorescence co-location of COX IV and LC3 at day 50. In the images, the nucleus staining is shown in blue, COX IV staining is shown in green, LC3 staining is shown in red, and the signals of colocalization are shown in merged images. (E) Pearson coefficient of the colocalization of COX IV and LC3. Data are expressed as means ± SD (n = 6). “*” indicates significant difference compared to the corresponding control (*P < 0.05, **P < 0.01). “#” indicates statistically significant difference between corresponding groups (#P < 0.05, ##P < 0.01).

