FIGURE 2.

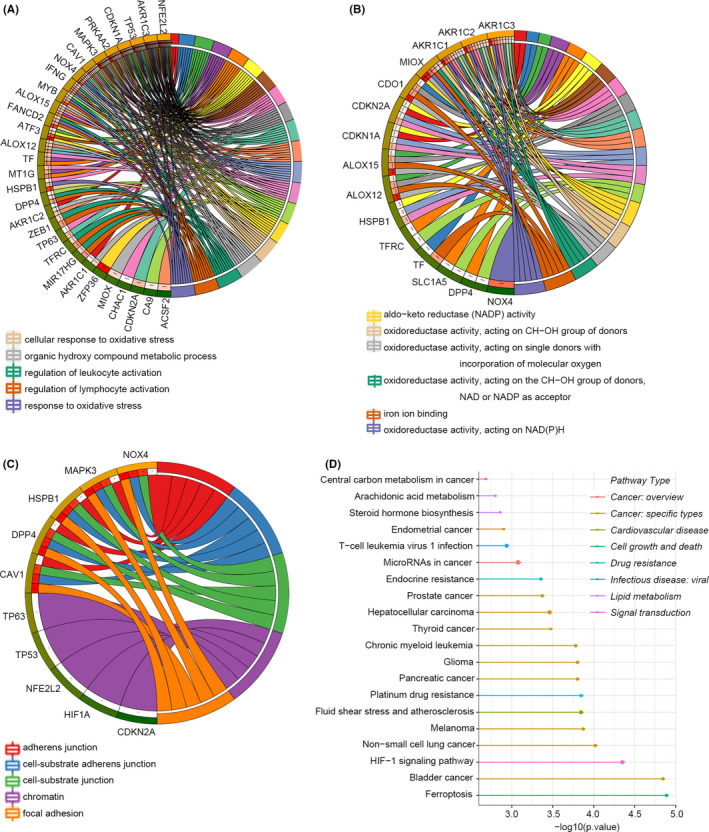
Functional enrichment analysis of SDG. (A–C) Biological process, cellular component and molecular function of GO analysis. (D) KEGG pathways. A larger circle indicates that more genes are enriched

Functional enrichment analysis of SDG. (A–C) Biological process, cellular component and molecular function of GO analysis. (D) KEGG pathways. A larger circle indicates that more genes are enriched