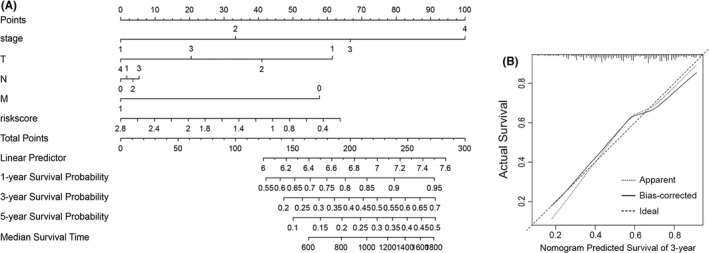
FIGURE 5.

Nomogram and calibration curve. (A) Based on each patient's variable value, draw an upward vertical line to the ‘Points’ bar to calculate points. Then, all the values are summed, and a downward vertical line is drawn from the ‘Total Points’ line to calculate the 1‐, 3‐ and 5‐year survival probability and the median survival time. (B) Calibration curve for the probability of 3‐year survival
