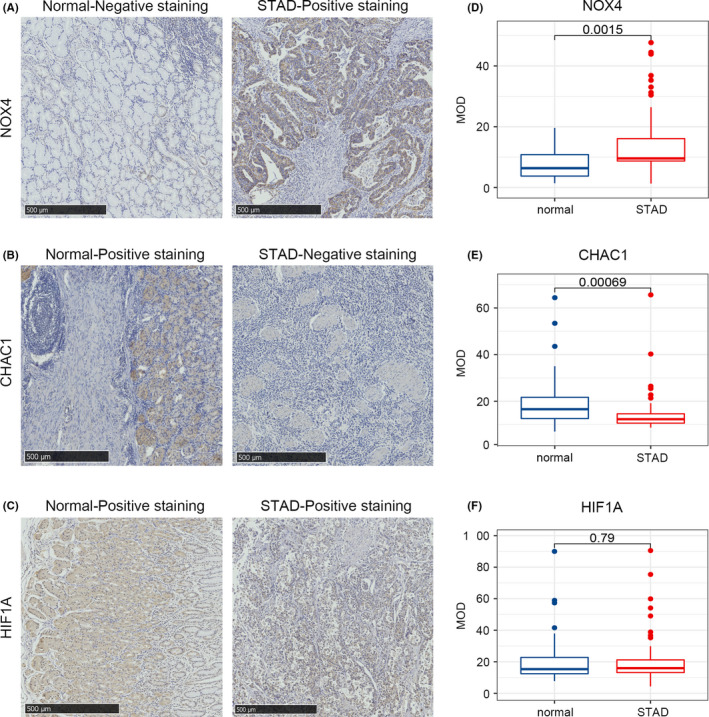
FIGURE 7.

Verification of differential expression of the key genes. (A–C) Representative immunohistochemistry images of STAD tissue and the corresponding paracarcinoma tissues of CHAC1 (A), NOX4 (B) and HIF1A (C). (D–F) Differences in the protein expression of the key genes in STAD tissues and normal tissues in the clinical samples by immunohistochemistry
