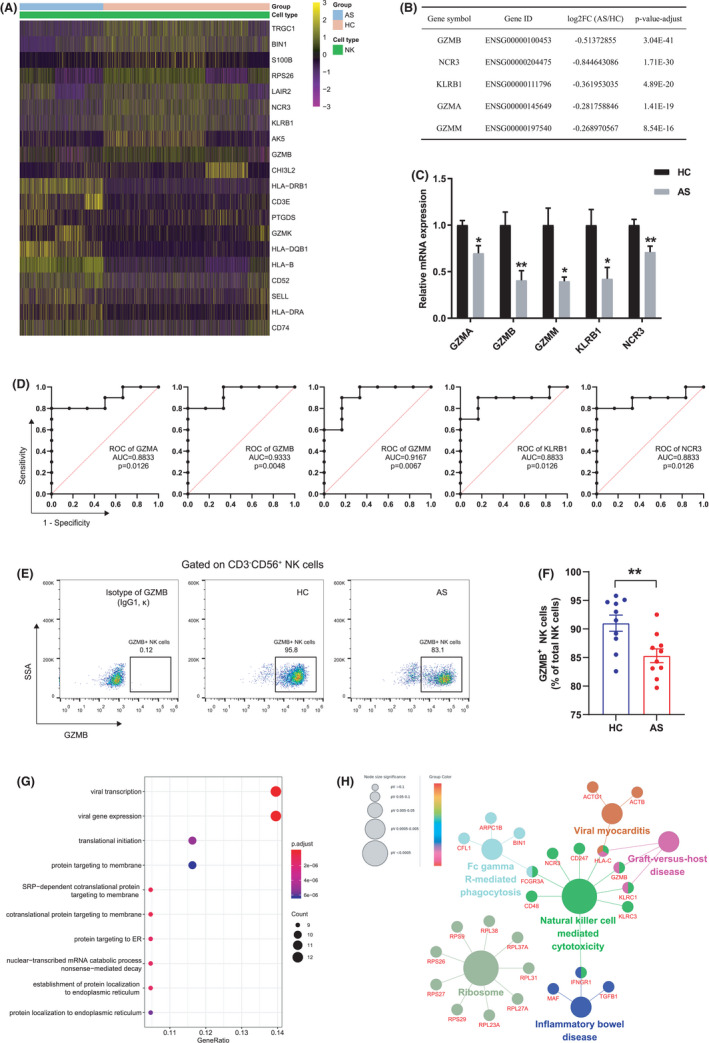
FIGURE 4.

Impaired expression of cytotoxic genes in NK cells of AS patients. (A) Heatmap illustration of the representative up‐ and downregulated genes in NK cells from AS patients. (B) Top 5 downregulated cytotoxicity‐related molecules or receptors in AS patients vs. HCs. (C) RT‐qPCR analysis of gene expression fold changes in AS patients vs. HCs. (D) ROC curves were plotted to assess the ability of these five genes to differentiate between AS patients and HCs. (E) Representative flow cytometry plots showing GZMB+ NK cells. (F) Proportions of GZMB+ NK cells in total NK cells of HCs (n = 10) and AS patients (n = 10). (G) Top 10 biological processes for downregulated genes were shown in bubble plot according to gene ratio. (H) Use ClueGO plugin to analyse enriched KEGG pathways for downregulated genes. A gene involved in multiple pathways was presented with multiple colours. Horizontal lines and error bars show the mean ± SEM. *p < 0.05; **p < 0.01
