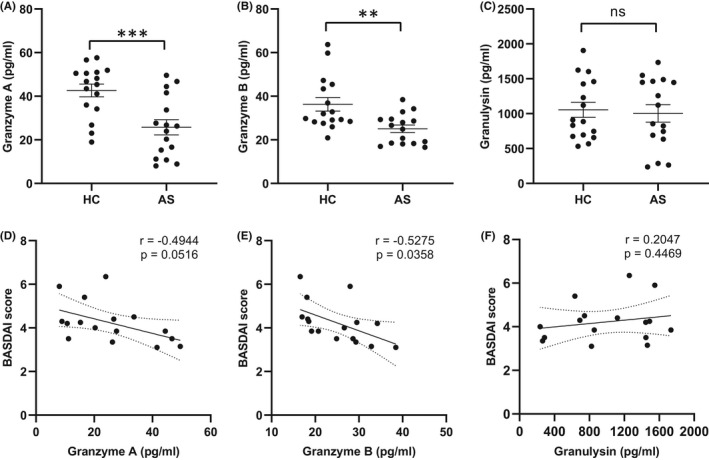
FIGURE 5.

Expression of cytolytic molecules in plasma of HCs (n = 16) and AS patients (n = 16). The plasma levels of granzyme A (A), granzyme B (B) and granulysin (C) were determined by enzyme‐linked immunosorbent assay. Pearson correlation analysis was performed between granzyme A (D), granzyme B (E), granulysin (F) and disease activity (BASDAI). Horizontal lines and error bars show the mean ± SEM. **p < 0.01; ***p < 0.001; ns = not significant
