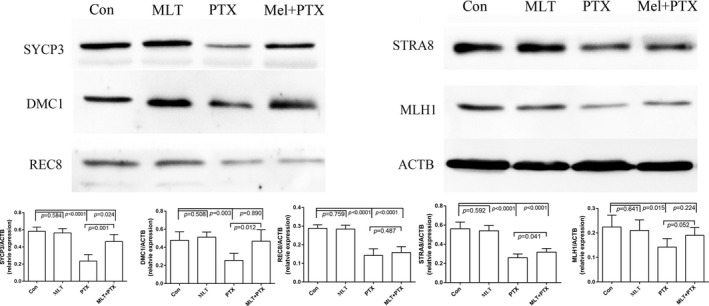
FIGURE 5.

Expressions of key spermatogenesis‐related in control and PTX‐treated mice testes. Samples were analysed by Western blot and repeated three times, followed by quantification through their IODs. The statistical analysis was performed by one‐way ANOVA; p < 0.05 was considered significant. Mel, MLT; PTX, PTX
