FIGURE 6.

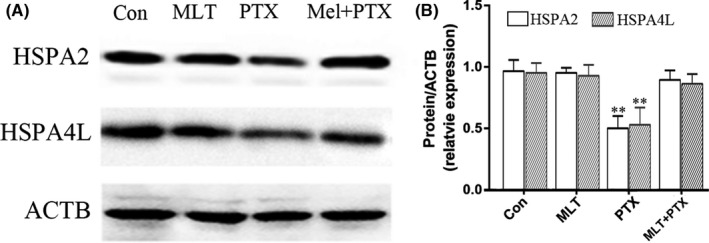
Expressions of HSPA2 and HSPA4L in control and PTX‐treated mice testes. Mel, MLT; PTX, PTX. The data were analysed through one‐way ANOVA; **, p < 0.01 was considered as significant

Expressions of HSPA2 and HSPA4L in control and PTX‐treated mice testes. Mel, MLT; PTX, PTX. The data were analysed through one‐way ANOVA; **, p < 0.01 was considered as significant