
FIGURE 7.
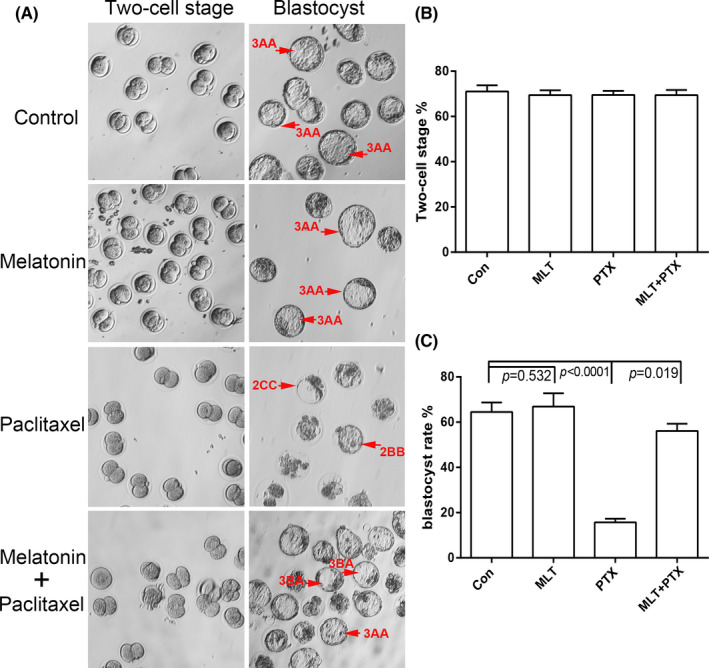
Characteristics of male fertility of MLT and PTX‐treated mice by IVF analysis A, Representative image of two‐cell embryos and blastocysts in different groups; B, Statistical analysis of two‐cell stage rate, which was defined as a percentage of the two‐cell embryos/ the number of pronucleus formation oocytes; C. Statistical analysis of blastocyte rate, which as defined as a percentage of the blastocytes/ the number of the two‐cell embryos. p < 0.05 was considered as the significant