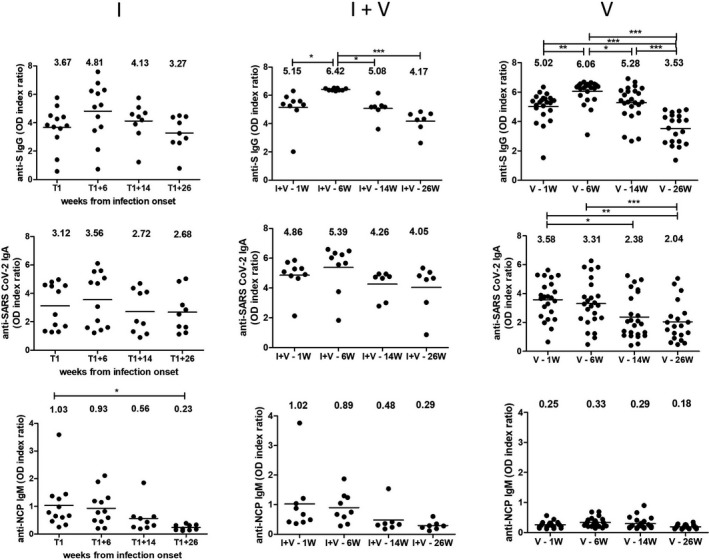
FIGURE 2.

Changes in antibody levels over time. Sequential analysis of isotypic antibody responses (anti‐S IgG, IgA and anti‐NCP IgM) to SARS‐CoV‐2 for plasma samples collected over a 6 months period. Groups description: natural SARS‐CoV‐2 infection without vaccine (I), with prior SARS‐CoV‐2 infection and vaccine (I + V), and vaccinated without prior infection (V). *p < 0.05, **p < 0.01 and ***p < 0.001
