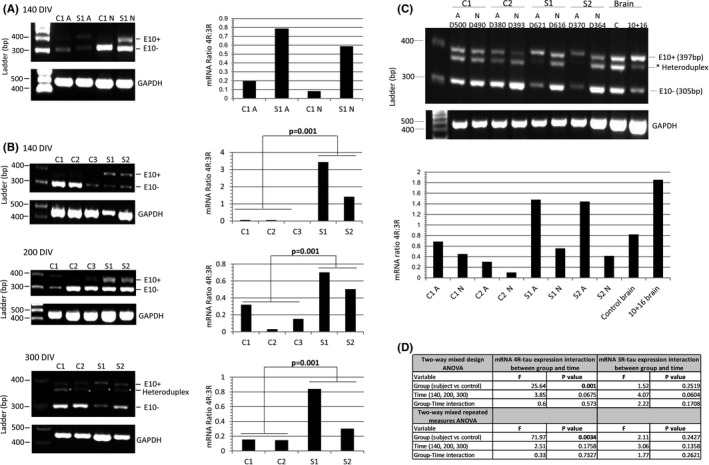
FIGURE 1.

The mRNA 4R:3R‐tau levels in controls and 10+16 asymptomatic carriers at 140–300 DIV. (A) The mRNA 4R‐tau levels were analysed between astrocytes (A) and neurons (N) at 140 DIV. Ratios of 4R‐tau relative to 3R‐tau expression in astrocytes with or without mutation were higher compared with neurons at same time‐point. (B) Astrocytes at different DIV were analysed to determine the levels of 4R‐tau expression between controls and patients. Astrocytes with the 10+16 mutation expressed elevated 4R:3R‐tau mRNA ratio compared to controls and these values were consistent in the different time‐points. (C) Analysis of the 4R:3R‐tau mRNA between astrocytes and neurons after 370–620 DIV. Standard and fluorescent PCR of mRNA tau expression was performed to confirm the intermediate band (asterisk) as heteroduplex artefact and discard from quantification. The two PCR products at 397bp and 305bp correspond to 4R (exon 10+) and 3R‐tau (exon 10−), respectively. An affected 10+16 post‐mortem brain tissue and a healthy age‐matched donor samples were included in the analysis. The astrocytes (A) (with and without mutation) showed an increased 4R:3R‐tau mRNA ratio compared with neurons (N) at same time‐point. The 3R and 4R‐tau expression pattern differed also between controls and 10+16 carrier cell lines (also see Figure S3). (D) A Shapiro‐Wilk test was used to assess normality of distribution (Figure 1B). When variables were not normally distributed data were subjected to a log transformation. A two‐way mixed design ANOVA and a two‐way mixed repeated measures ANOVA was used to compare the results of the outcome variable (4R) with time (100, 200 and 300 DIV) as within‐patients variables and group (case versus control) as a between‐patients variable for three repetitions and four repetitions separately. The mRNA 4R‐tau expression in astrocytes at different time points showed statistically significant differences between carriers and controls and 4R‐tau expression did not show significant differences over time (140, 200 and 300 DIV) or the interaction between disease group and time. The mRNA results for expression in 3R‐tau showed no significant differences among cases vs. controls, over time or with the interaction between group and time (Figure 1B) (also see Table S1)
