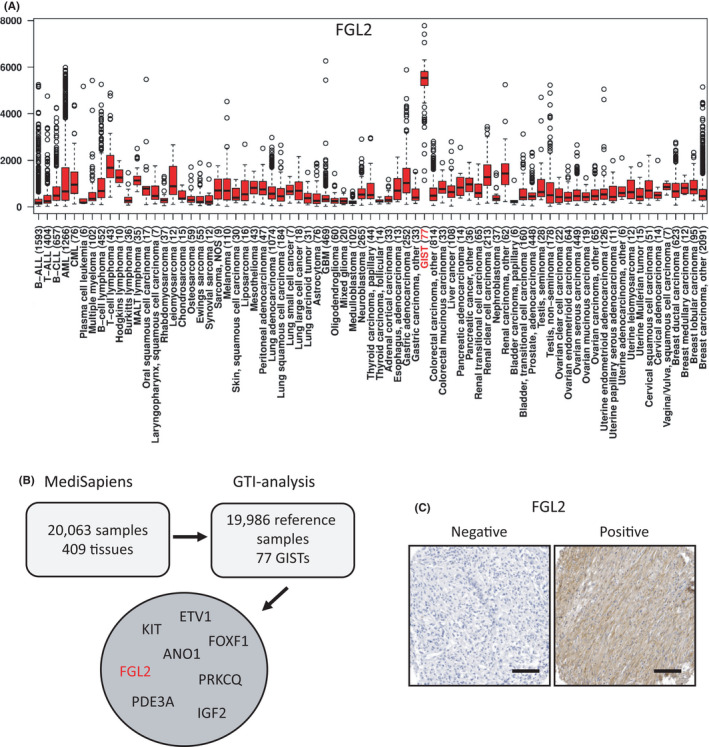
FIGURE 1.

(A) A box‐whisker plot showing the relative FGL2 mRNA expression in cancer. The bottom and the top of the box depict the 25th percentile and the 75th percentile, respectively, and the horizontal line the median. The whiskers extend to 1.5 times the interquartile range from the edges of the box, and the data points beyond the whiskers are marked with hollow circles. The number of samples studied is indicated in the brackets (modified from IST Online, ist.medisapiens.com). (B) GIST signature genes in the top 100 outlier list of the gene tissue index (GTI) analysis. mRNA expression profiles of GISTs were ranked using the GTI outlier statistics using the MediSapiens IST Online database. (C) Representative immunohistochemical stainings of FGL2‐positive and FGL2‐negative GIST tissue samples (magnification ×200; scale bar, 100 μm)
