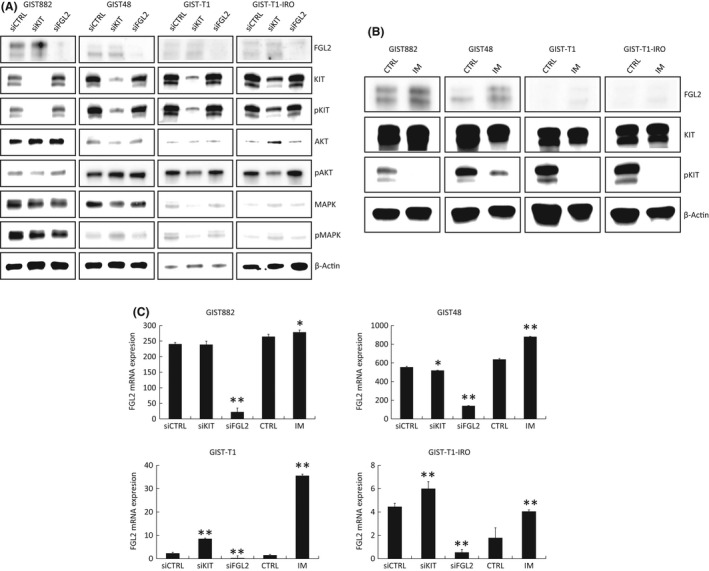
FIGURE 3.

(A) A western plot showing expression of FGL2, KIT, phosphorylated KIT (Y719), AKT, phosphorylated AKT (S473), MAPK, phosphorylated MAPK (T202/Y204) and β‐actin (control) in the GIST882, GIST48, GIST‐T1 and GIST‐T1‐IRO cell lines. Expression 72 hours after KIT and FGL2 siRNA transfection are shown. (B), A western blot showing the FGL2, KIT, phosphorylated KIT (Y719) and β‐actin (control) expression in the GIST882, GIST48, GIST‐T1 and GIST‐T1‐IRO cell lines 72 hours after imatinib (1 μmol/L) treatment. (C) Normalized FGL2 mRNA expression measured with qPCR from the GIST cell lines 72 hours after KIT and FGL2 siRNA transfection or imatinib (1 μmol/L) treatment. *p < 0.05, and **p <.001. The P values refer to the comparisons with the controls (CTRL). Data represent the mean ±the standard error of mean (SEM). A G:BOX Chemi XX9 imaging system was used for western blot imaging (A, B) leading to clear white backgrounds
