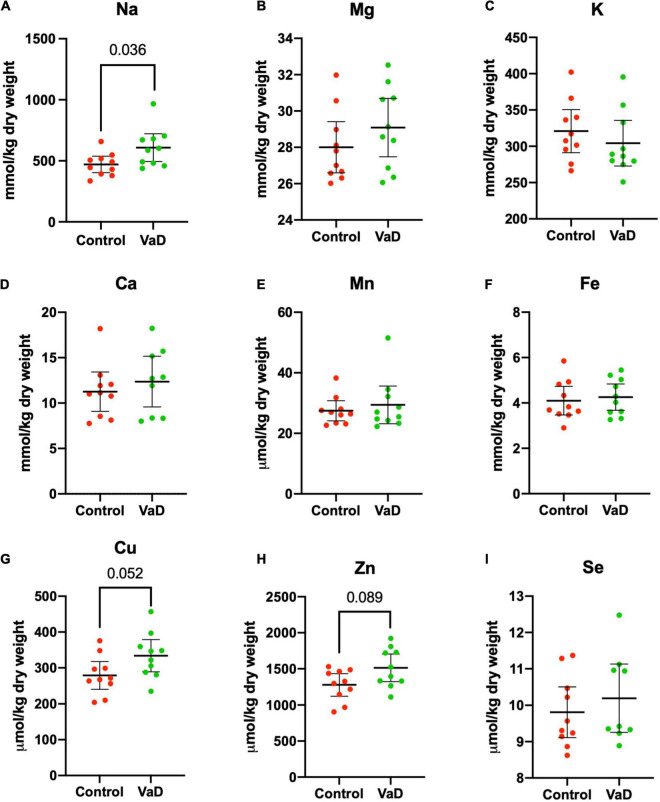
FIGURE 2.
Dry-weight concentrations of nine essential elements (A–I) in the hippocampus compared between control (red) and VaD (green) post-mortem human tissue. Data shown represent elemental means ± 95% CI from control (n = 10) and VaD (n = 10). A single outlier from each of Ca and Se datasets was removed from the plot for clarity. n = number of post-mortem human samples.

